
Erasmus Plus Call 2021 Round 1 KA2 funded by EU KA220-SCH
Cooperation partnerships in school education
Let’s Save Our Environment and Our Future
Project number: 2021-1-DE03-KA220-SCH-000023948
Handbook
Kit 11-17 age
Author: CSFNSM
Ver 1.0
Title: Handbook KIT 11-17 age Manuscript completed in June 2024
Erasmus+ Project no: KA220-SCH
Let’s Save Our Environment and Our Future Project number:
COPYRIGHT NOTICE
“Unless otherwise noted, the reuse of this document is authorised under the Creative Commons Attribution 4.0 International (CC BY 4.0) licence (https://creativecommons.org/licenses/by-nc-sa/4.0/). This means that reuse is allowed, provided that appropriate credit is given and any changes are indicated”.
Attribution- NonCommercial-ShareAlike 4.0 International (CC BY-NC-SA 4.0) You are free to:
Share — copy and redistribute the material in any medium or format
Adapt — remix, transform, and build upon the material
The licensor cannot revoke these freedoms as long as you follow the license terms.
Under the following terms:
Attribution — You must give appropriate credit, provide a link to the license, and indicate if changes were made. You may do so in any reasonable manner, but not in any way that suggests the licensor endorses you or your use.
NonCommercial — You may not use the material for commercial purposes.
ShareAlike — If you remix, transform, or build upon the material, you must distribute your contributions under the same license as the original.
No additional restrictions — You may not apply legal terms or technological measures that legally restrict others from doing anything the license permits.
We live together on the Earth planet: a wonderful mixture of mountains, seas, oceans, plants, animals, etc. However, with the growing of industrial activities and the expansion of urbanization, most of our planet resources are in dangerous: forests are disappearing, the quality of air is becoming worse, water is greatly polluted, especially near the city.
Environmental protection is responsibility of Government as well of every citizen of all age. Everyone should make effort to protect the environment. Putting in place Environmental Protection Measures means organize actions to effect Environmental Quality, including but not limited to, assessment and prediction of impacts, monitoring, measure to avoid or mitigate impacts, setting of limits for environmental degradation, etc.
But what kind of things are we capable of to protect the environment?
Education is the first measurement that we can do: creating awareness of problems is the first step in trying to solve them.
To begin let’s try to know nature better by measuring the parameters and quantities that characterize it, such as temperature, humidity, atmospheric pressure, water quality, light, color, light and so on…
KIT 11-17
Materials needed.
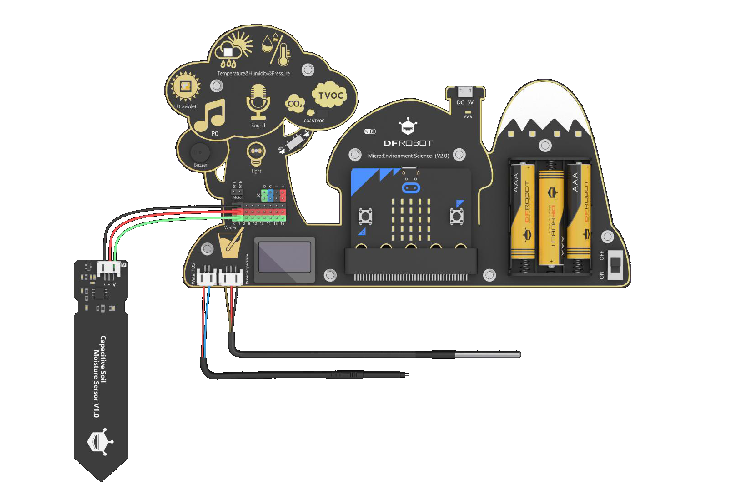
1 Electronic Board: Environment Science Expansion Board for micro:bit -V2.0 (SKU: MBT0034)
1 MicroBit v2.X card
USB cable
3AAA Battery (not needed if you connect the card to the computer)

test tubes
ph strips (Tornasole strips)
various water samples (e.g. mineral water, tap water, spring water, puddle water, etc.)
other liquids (e.g. soft drinks)
salt
Calcium Carbonate (just the one you find in your house, no need of any dangerous chemical components)
various types of soil
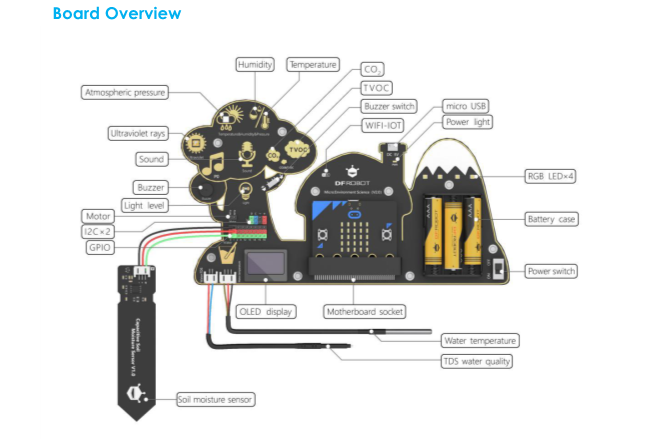
This micro:bit-based expansion board allows students to measure environmental conditions for scientific experiments by using rich on-board sensors. It aims to provide a platform for students to learn theory with practices and bring science education closer to daily life!
Integrated sensors include temperature sensor, humidity sensor, air pressure sensor, sound sensor, UV sensor, light sensor, water temperature sensor, and a TDS (Total Dissolved Solids) water quality sensor, soil moisture sensor, etc.
The specific characteristic of each sensor is reported in the following:
BME280 Environment Sensor
Operating Current: 2mA
Operating Temperature: -40 oC – +85 oC
Temperature Measuring Range: -40 oC – +85 oC; Resolution 0.1 oC,Deviation ±0.5 oC
Humidity Measuring Range: 0~100%RH, Resolution 0.1%RH,Deviation±2%RH
Response Time of Humidity Measurement: 1S
Atmospheric Pressure Measuring Range: 300~1100hPa
Waterproof Temperature Sensor
Temperature Display Range: -10 oC – +85 oC (Deviation±0.5 oC)
Operating Temperature Range: -55 oC – 125 oC
Query Time: less than 750ms
TDS Water Quality Sensor
The TDS probe should not be used in water above 55°C.
The TDS probe should not be placed too close to the edge of the container,
as this will affect the accuracy.
CCS811 Air Quality Sensor
Operating Temperature Range: -40°C~85°C
Operating Humidity Range: 10%RH~95%RH
CO2 Measuring Range: 400ppm~8000ppm
TVOC Measuring Range: 0ppb~1100ppb
Capacitive Soil Humidity Sensor
Operating Voltage: 3.3V-5.5V DC
Output Voltage: 0-3.0V
DC Connector: PH2.0-3P
RGB Light
RGB Light Model: WS2812
Port: P15
Light Sensor
Output Data Type: analog value
Data Range: 0-1023
ML8511 UV Sensor
Operating Temperature: -20°C~70°C
Sensitive Area: UV-A, UV-B
Sensitivity Wavelength: 280-390nm
Buzzer
Dimension: 9mm in diameter
Software repository
https://drive.google.com/drive/folders/1He2CAtqvvJDPl7HI7aVEE3QqQ-7zIZKg?usp=share_link
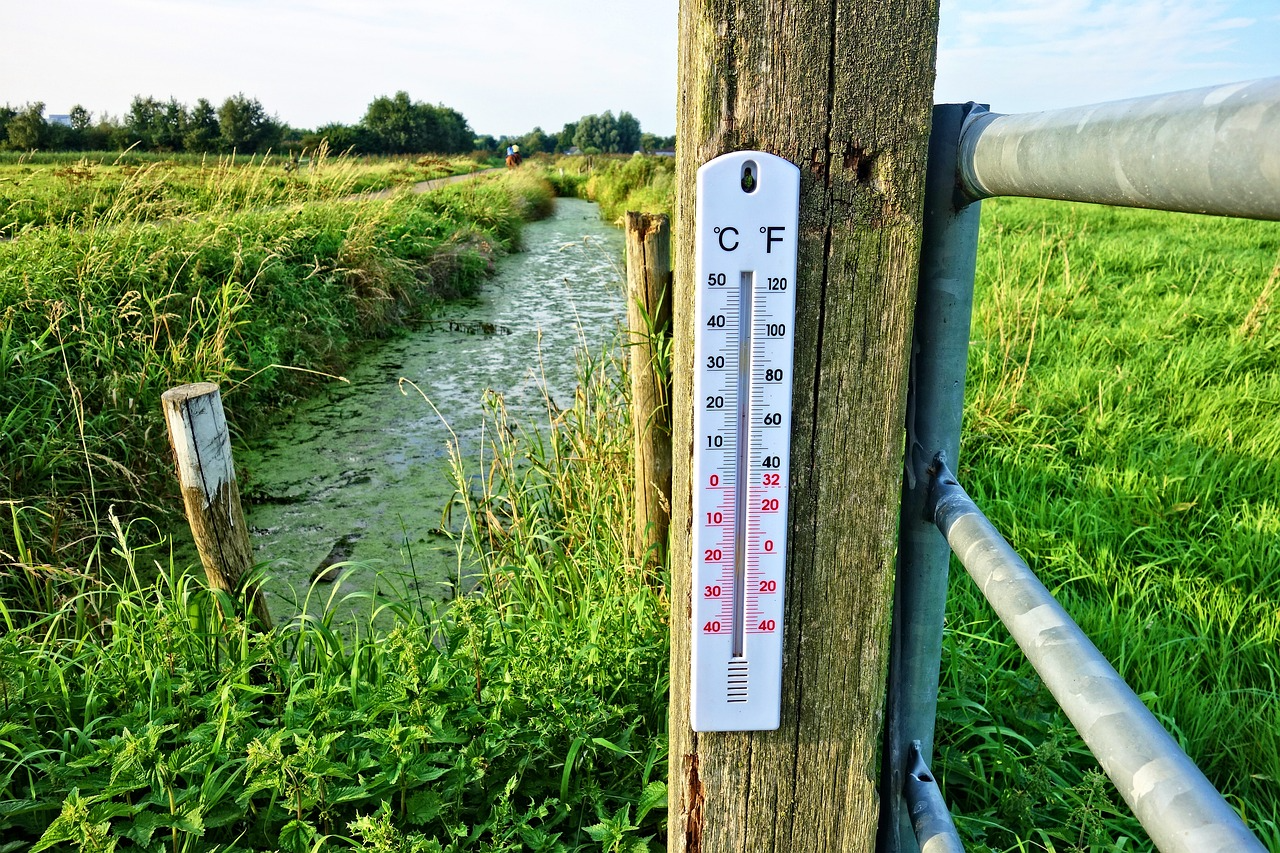
Among many environmental parameters, temperature and humidity are the ones which mainly impacts on human health and comfort.
According to national legal provisions and those dictated by the WHO (the World Health Organization), the ideal temperature to keep in the home must be around 20° C, with a maximum fluctuation of 2° above or below.
The humidity rate, however, must be around 40-50%. More specifically, during the winter, having a good level of humidity helps to avoid dryness of the mucous membranes of the respiratory system. In summer, however, if you use the air conditioner, you need to dehumidify the environment, since it is precisely the humidity that is too high that makes you feel muggier. The ultra-low humidity will lead to excessive drying, one is easy to produce static electricity and increase the density of dust easily, so 50%-60% humidity is appropriate. On the contrary, an environment with too high humidity creates excess moisture and condensation that potentially leads to mold or rot.
These values of course depend also on the season and from the specific climate of region. Generally, the human body feel comfortable when the temperature is between 17-28 degrees and the humidity between 50%-60%.
So, what affects the temperature and humidity of the environment? How can we measure temperature and humidity?
Temperature Measurements
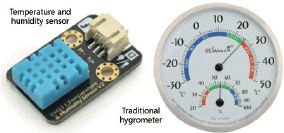
The most common device to measure the temperature of a system is a thermometer. The most common thermometers are the “bulb-ones”, which usually are mercury-in-glass thermometers or digital thermometers base on infrared.
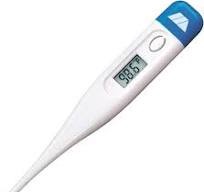
Units: Currently the most common temperature units are: Celsius (C) and Fahrenheit (F)
In the age of the Internet of Things, we also use a device called a “temperature sensor” to measure temperature and can display the measured data on a screen or to a computer for analysis. Smaller and easier to use.
So let’s start with our first measurement: the environmental temperature.
Environmental Temperature measurement:
Instructions: let’s keep the environmental board and the micro:bit board. Insert the micro:bit board in the appropriate slot and connect the micro:bit board to your computer using the USB cable.
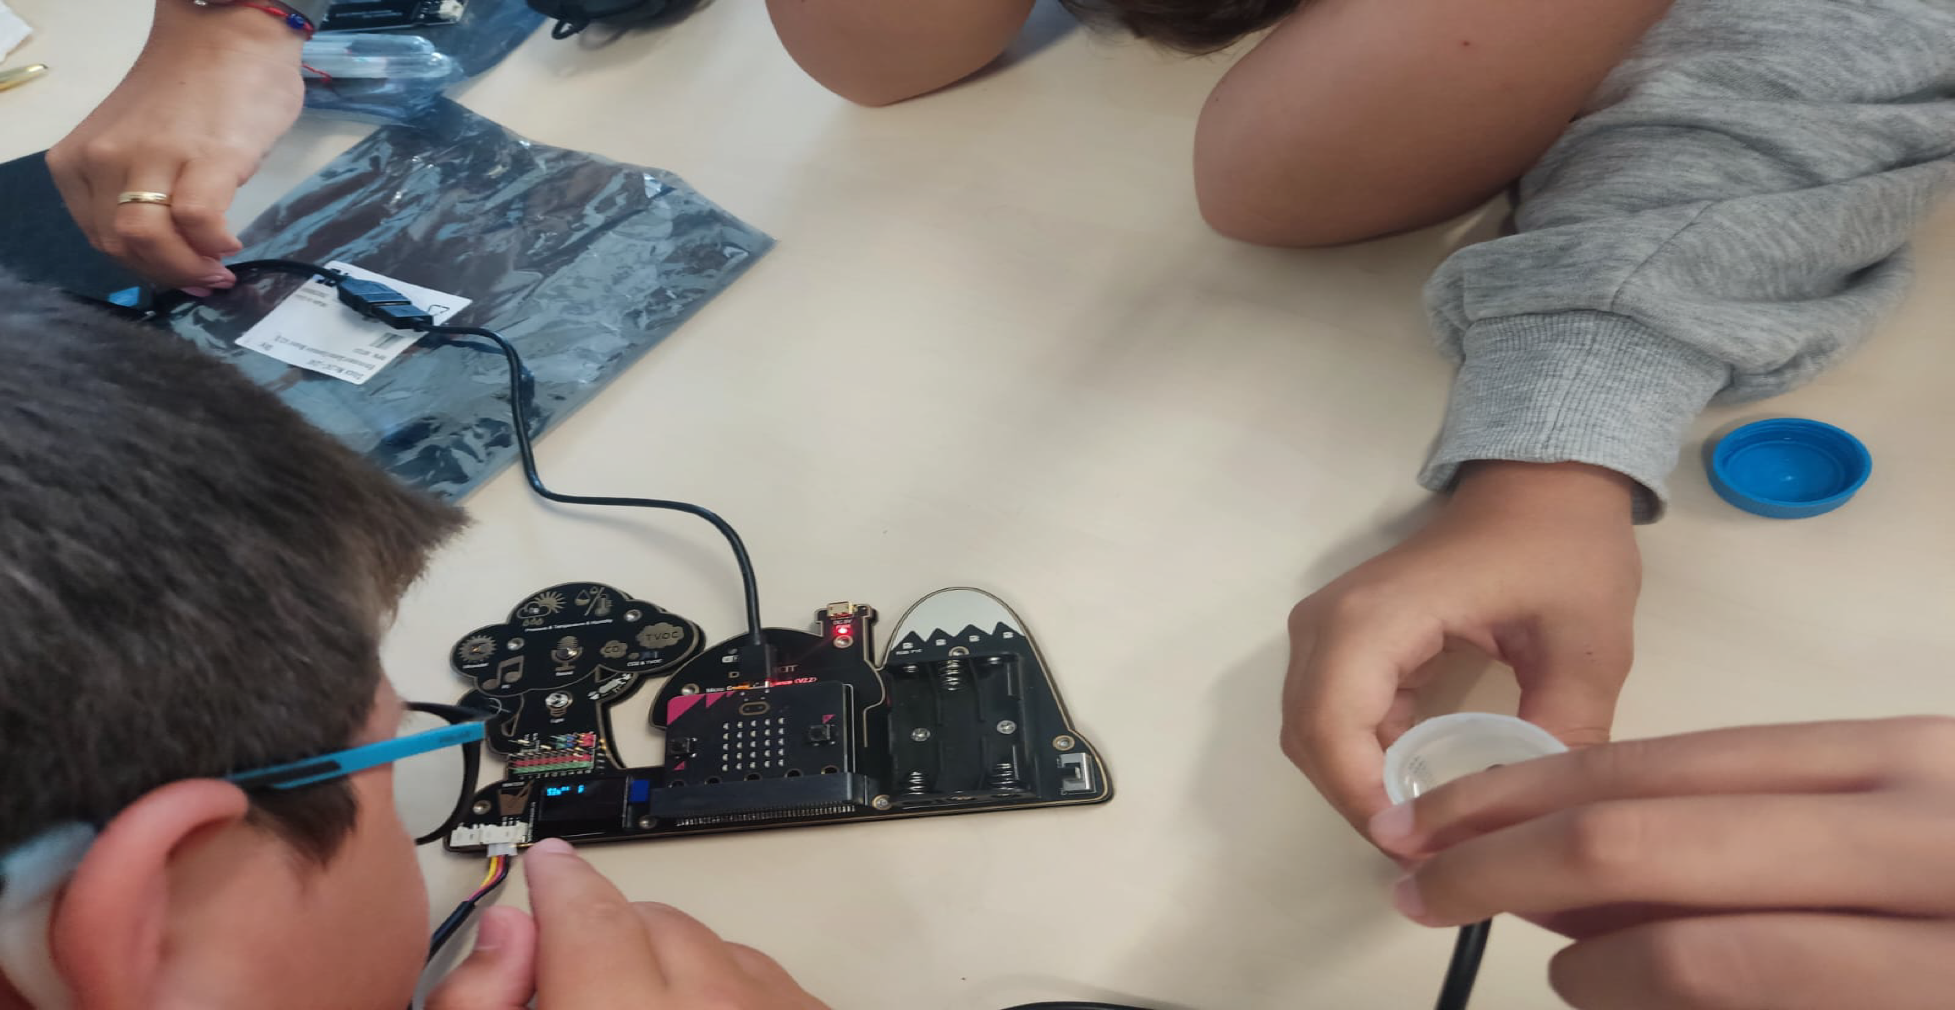
Open a browser (we strongly suggest to use Chrome) and go to the makecode site
https://makecode.microbit.org/
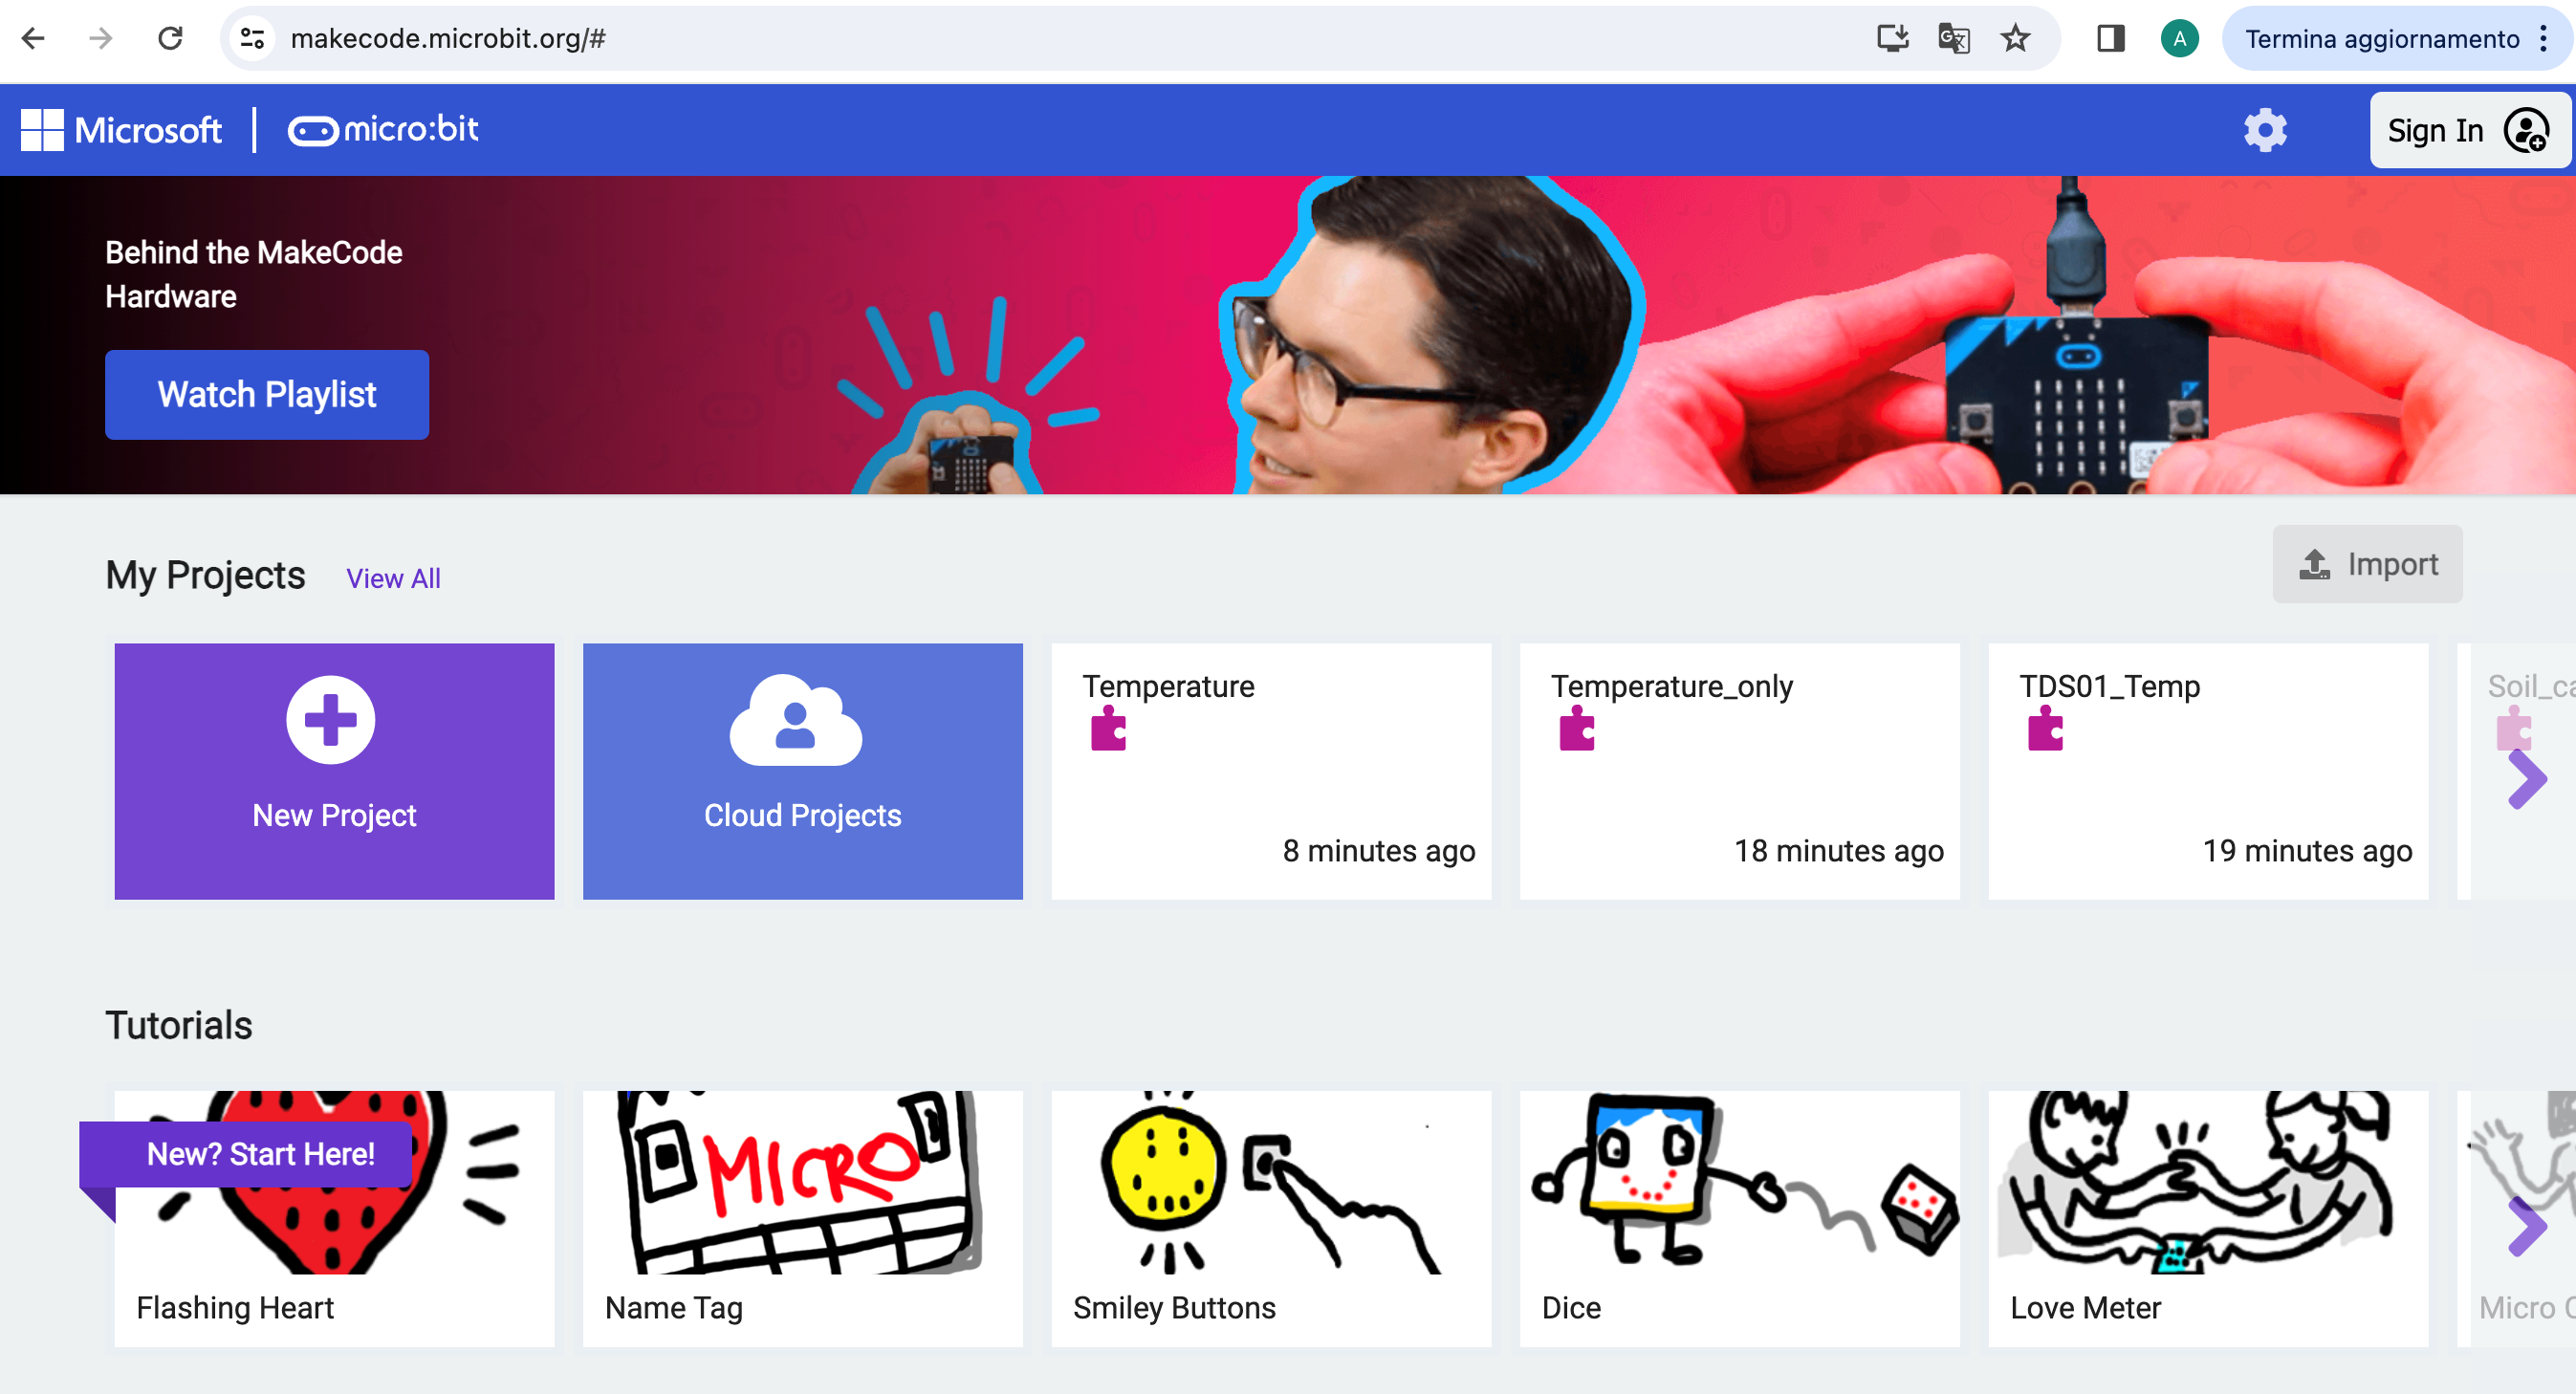
In order to transfer the code to the electronic board, the first step to do is to clic on
DOWNLOAD (bottom left)
If it is the first time that you connect the board to the PC it will ask you to pair the PC and the board, otherwise it will do automatically.
This program will enable you to measure the environmental temperature that will be shown in the OLED screen on the board.
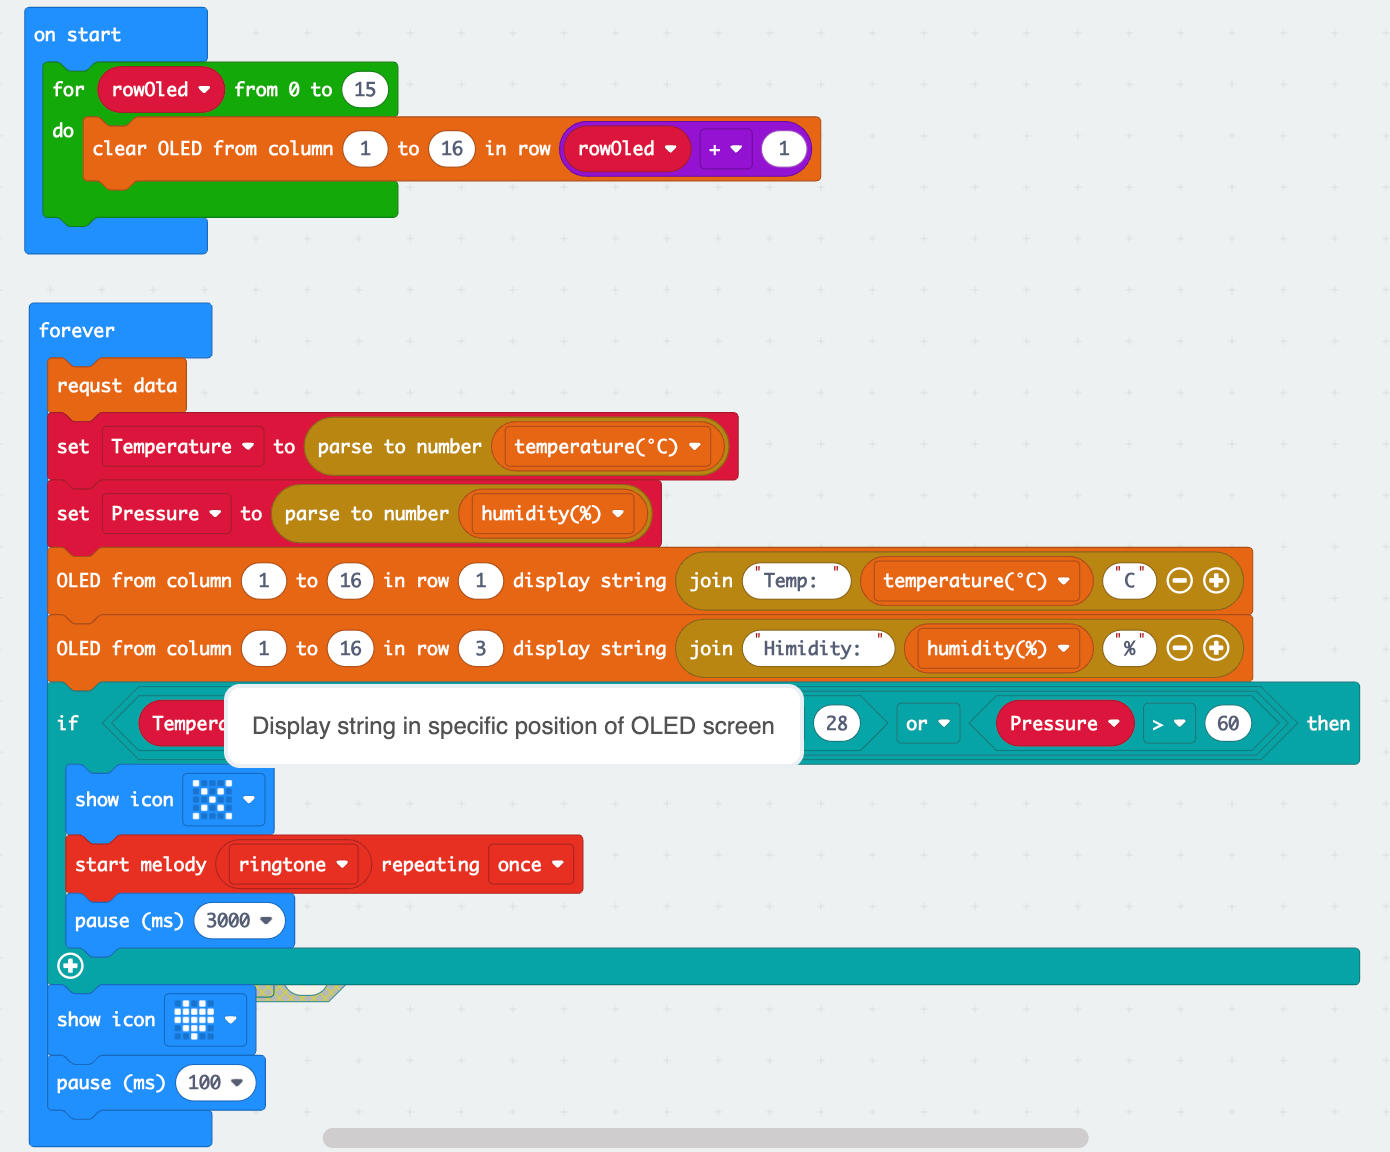
In the following picture you will find a screenshot of the program as it will appear once you upload the program on the makecode site.
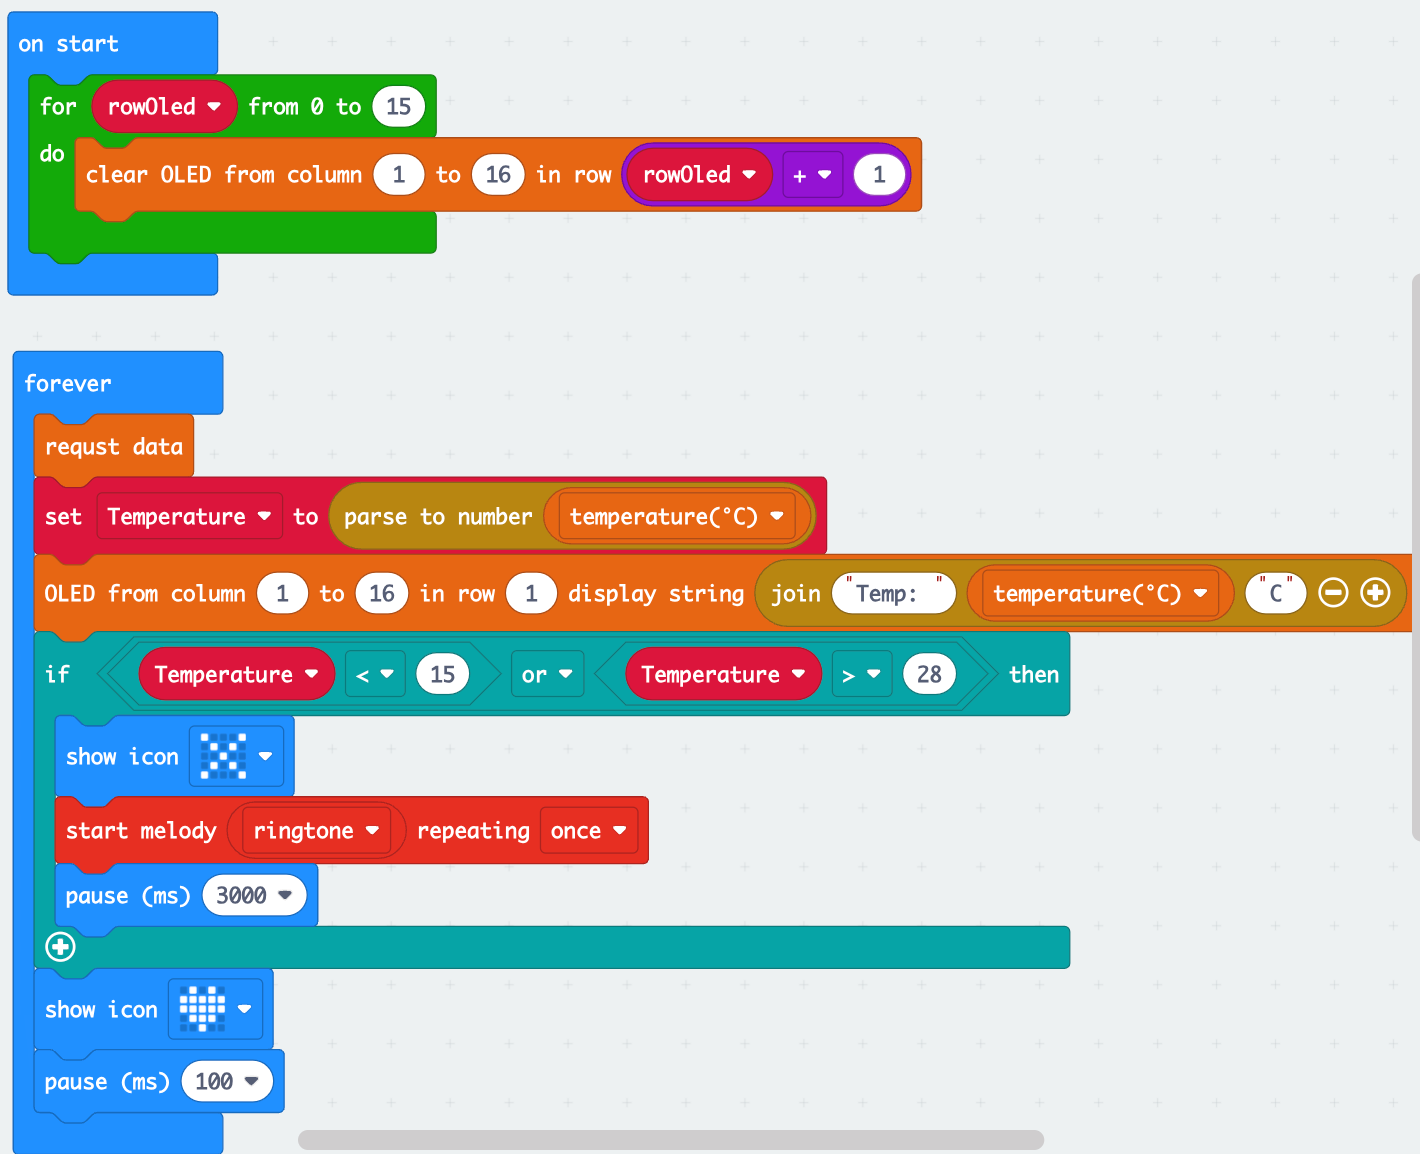
Once you upload the code, automatically it will run.
If the temperature will be in a comfortable (15 oC – 28 oC) range for human body a “heart” will be shown in the micro:bit board, on the contrary if the temperature is lower or higher than the fixed comfortable range the screen will show a “X” and the board will emit a sound.
Description of the code:
The code is composed by two parts.
In the first one:

At the start of the program (once for all), the OLED screen is cleaned up, so if some previous program was running, the values are cancelled, and the screen is ready to show the new measurements.
In the second one:
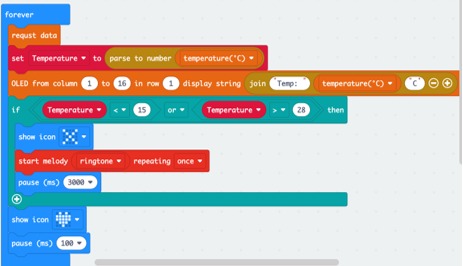
The electronic board is asked to provide the information about environmental temperature through the makecode instructions:
requested data
Set Temperature to Celsius degrees
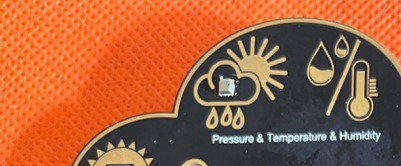
provided by the sensor temperature (upper left of the board):
The temperature is printed out on the OLED screen with the notation:
Temp: value in oC
If the temperature is lower than 15 oC or greater than 28 oC the program is instructed to print a “X” on the micro:bit board and to raise and alarm, while if the temperature is in between 15 oC and 28 oC a “Heart” is shown, to show up that the value is fine for the human working condition.
Additional check:
- You can start to change the allowed range of temperature and dowloand the program again to see the change.
- You can add an additional line to show the measured environmental temperature in Fahrenheit unit in addition to Celsius degrees.
- To familiarize with the code, you can change image and sound for the alarm condition.
Humidity measurement:
Humidity is the amount of water vapor in the air. If there is a lot of water vapor in the air, the humidity will be high. The higher the humidity, the wetter it feels outside.
Humidity, as well as temperature, is strictly related to weather condition and climate.
On the weather reports, humidity is usually explained as relative humidity. Relative humidity is the amount of water vapor in the air, expressed as a percentage of the maximum amount of water vapor the air can hold at the same temperature. Think of the air at a chilly -10 degrees Celsius (14 degrees Fahrenheit). At that temperature, the air can hold, at most, 2.2 grams of water per cubic meter. So, if there are 2.2 grams of water per cubic meter when it’s -10 degrees Celsius outside, we’re at an uncomfortable 100 percent relative humidity. If there were 1.1 grams of water in the air at -10 degrees Celsius, we’re at 50 percent relative humidity.
When humidity is high, the air is so clogged with water vapor that there isn’t room for much else. If you sweat when it’s humid, it can be hard to cool off because your sweat can’t evaporate into the air like it needs to. An excess of humidity can also cause damage to electronic equipment. Moisture from humid air settles, or condenses, on electronics. This can interrupt the electric current, causing a loss of power. Computers and television sets can lose power like this if not protected from the effects of humidity. Living with humidity is easier with the aid of a dehumidifier, which sucks moisture out of the air.
High humidity is also associated with hurricanes. Air with high moisture content is necessary for a hurricane to develop. U.S. states such as Texas and Louisiana, which border the very warm Gulf of Mexico, have humid climates. This results in tons of rainfall, lots of flooding and the occasional hurricane.
However, even an excessively dry climate is not ideal for humans and normally a humidity between 30-60% is appropriate enough.
Measurement of the relative humidity
In our electronic board the same sensor used to measure the temperature could also provide the relative humidity. However, we need to use a different code to get the %humidity value.
The basic idea of the code is the same as the one for the temperature measurement.
Please Import the file
Microbit-humidity.hex
and download it on the electronic board.
The code will simply clean up the OLED and then read and print-out the relative humidity value.

Additional test:
You can try to combine the read out of temperature and humidity in just one code and set an alarm if either the temperature is outside the 15-28 oC range or the relative humidity is higher than 60%.
Try holding our fingers down to this sensor, as shown in the figure:
We will find that two data change, especially the temperature, the change is very obvious, the temperature is constantly rising, because our body temperature is higher than the ambient temperature, by holding down the sensor, the body temperature is transmitted to the sensor.
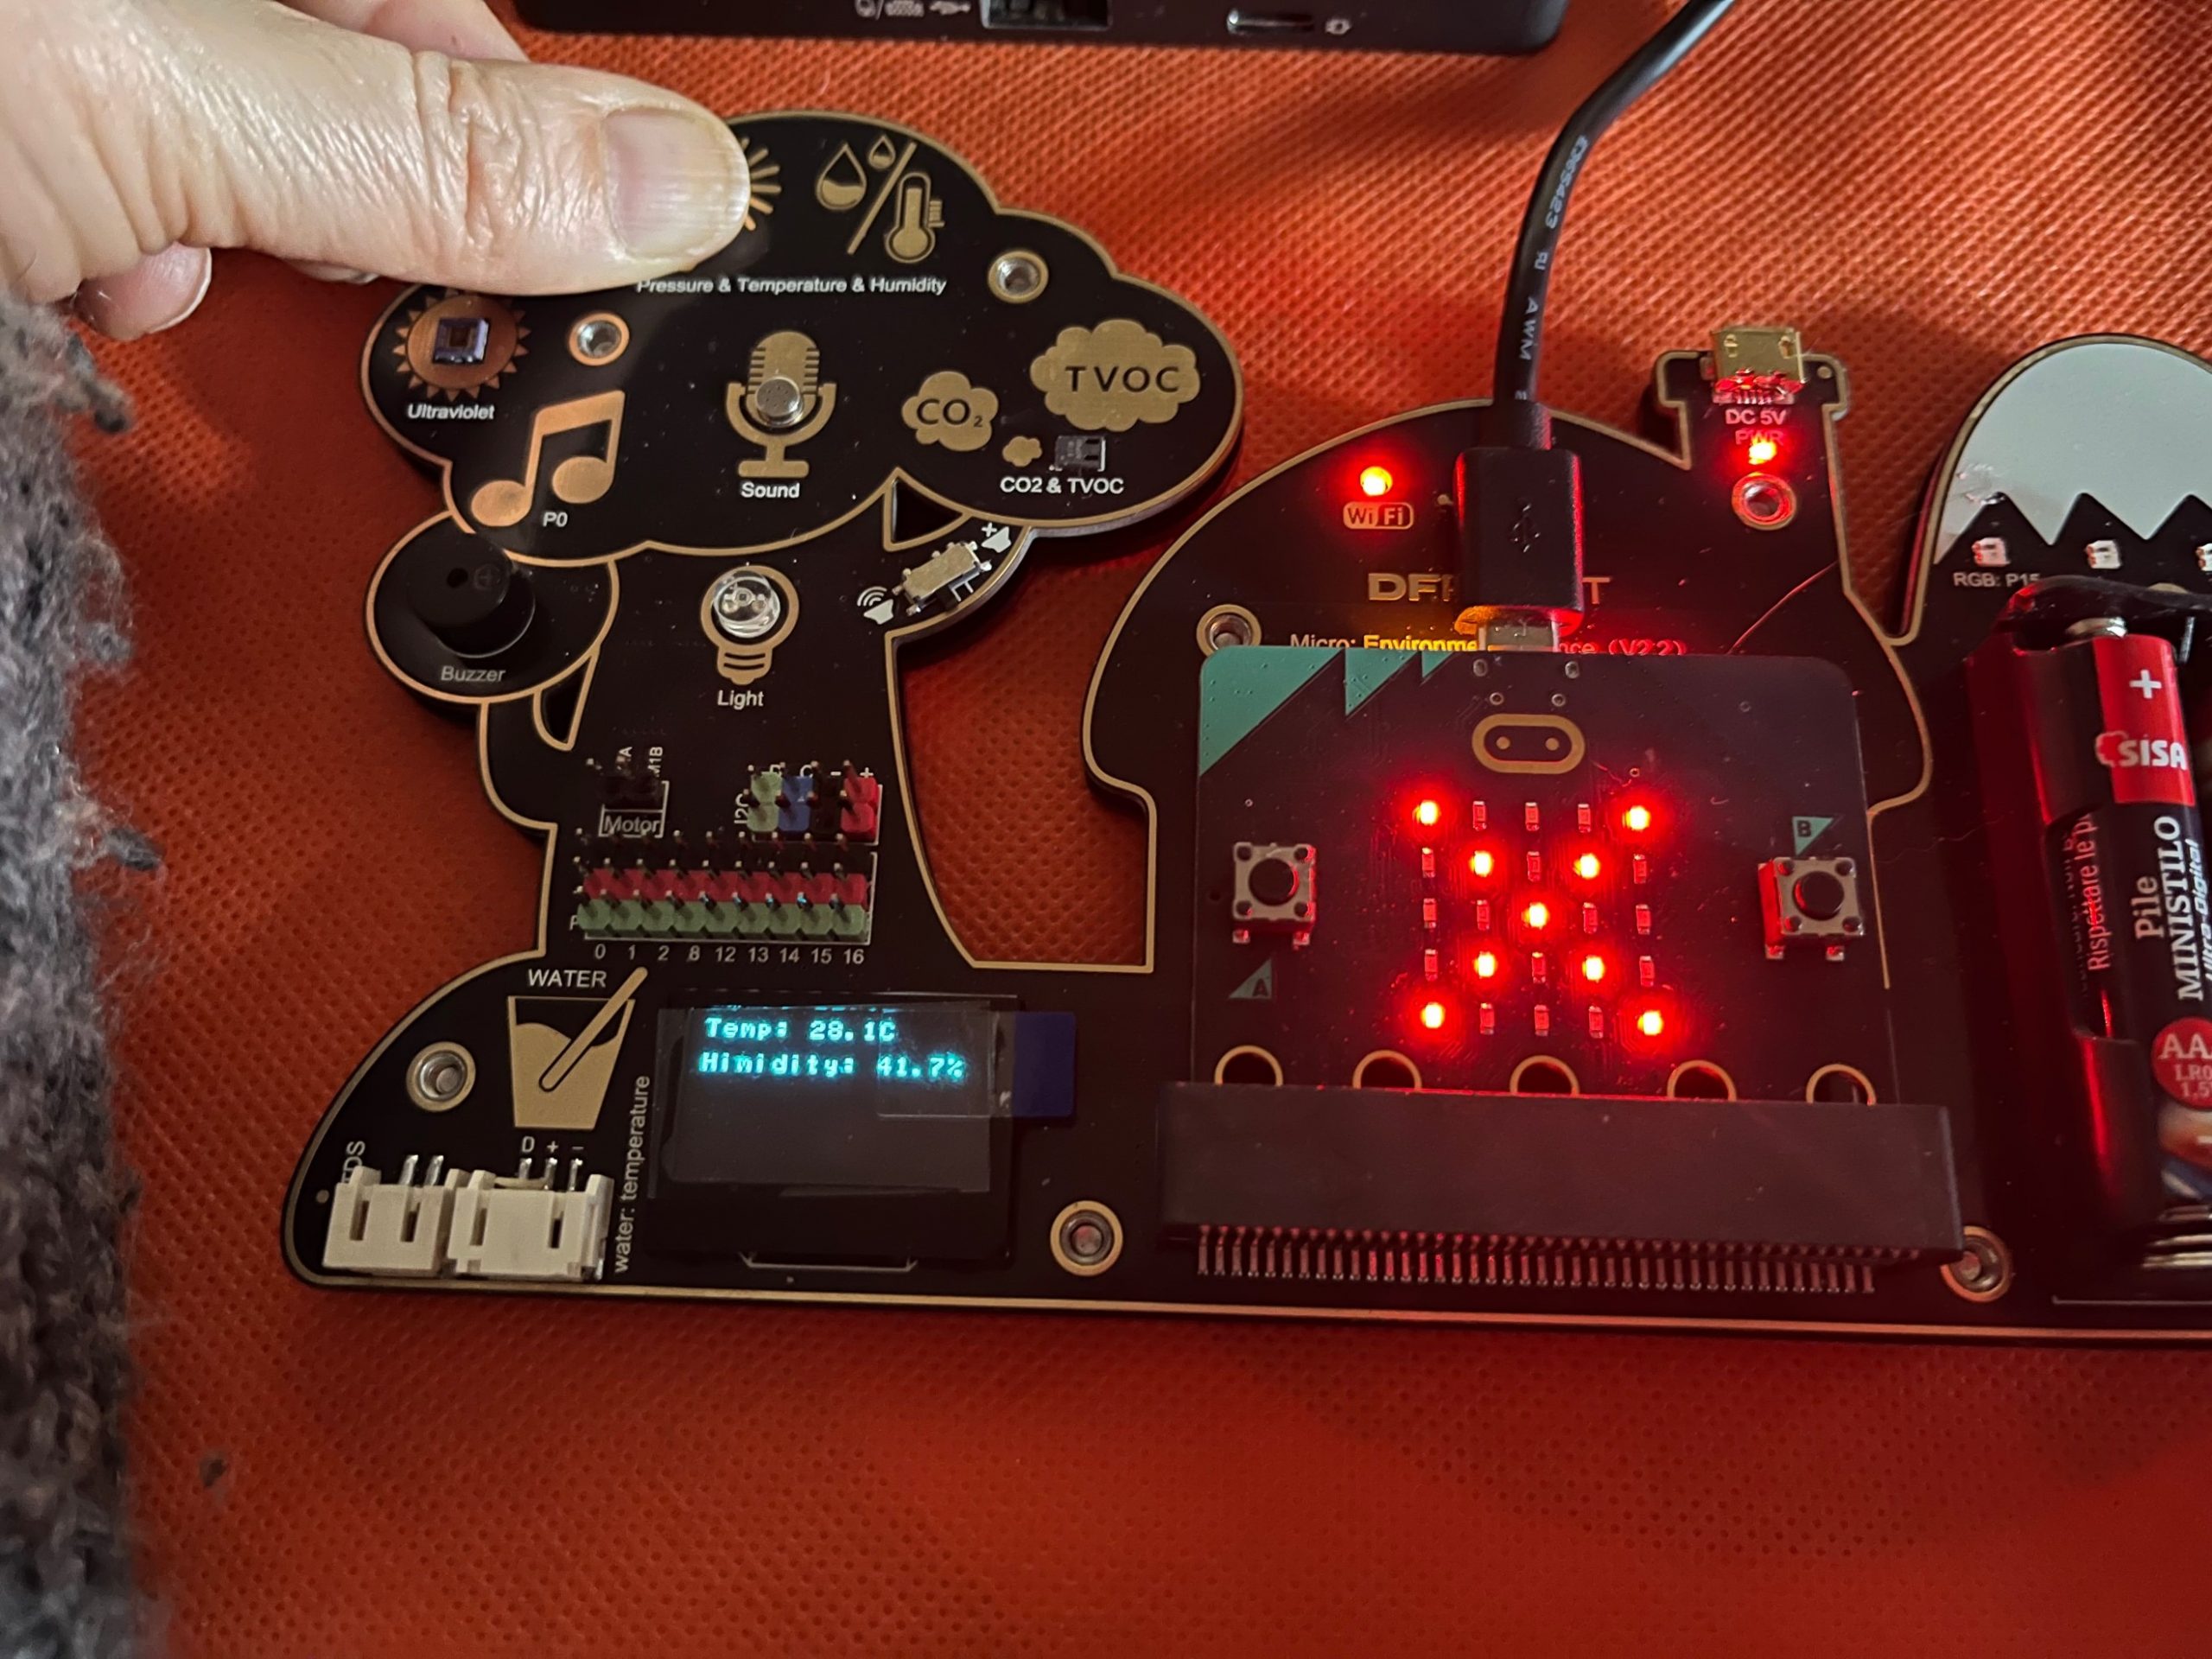
High temperature – normal humidity
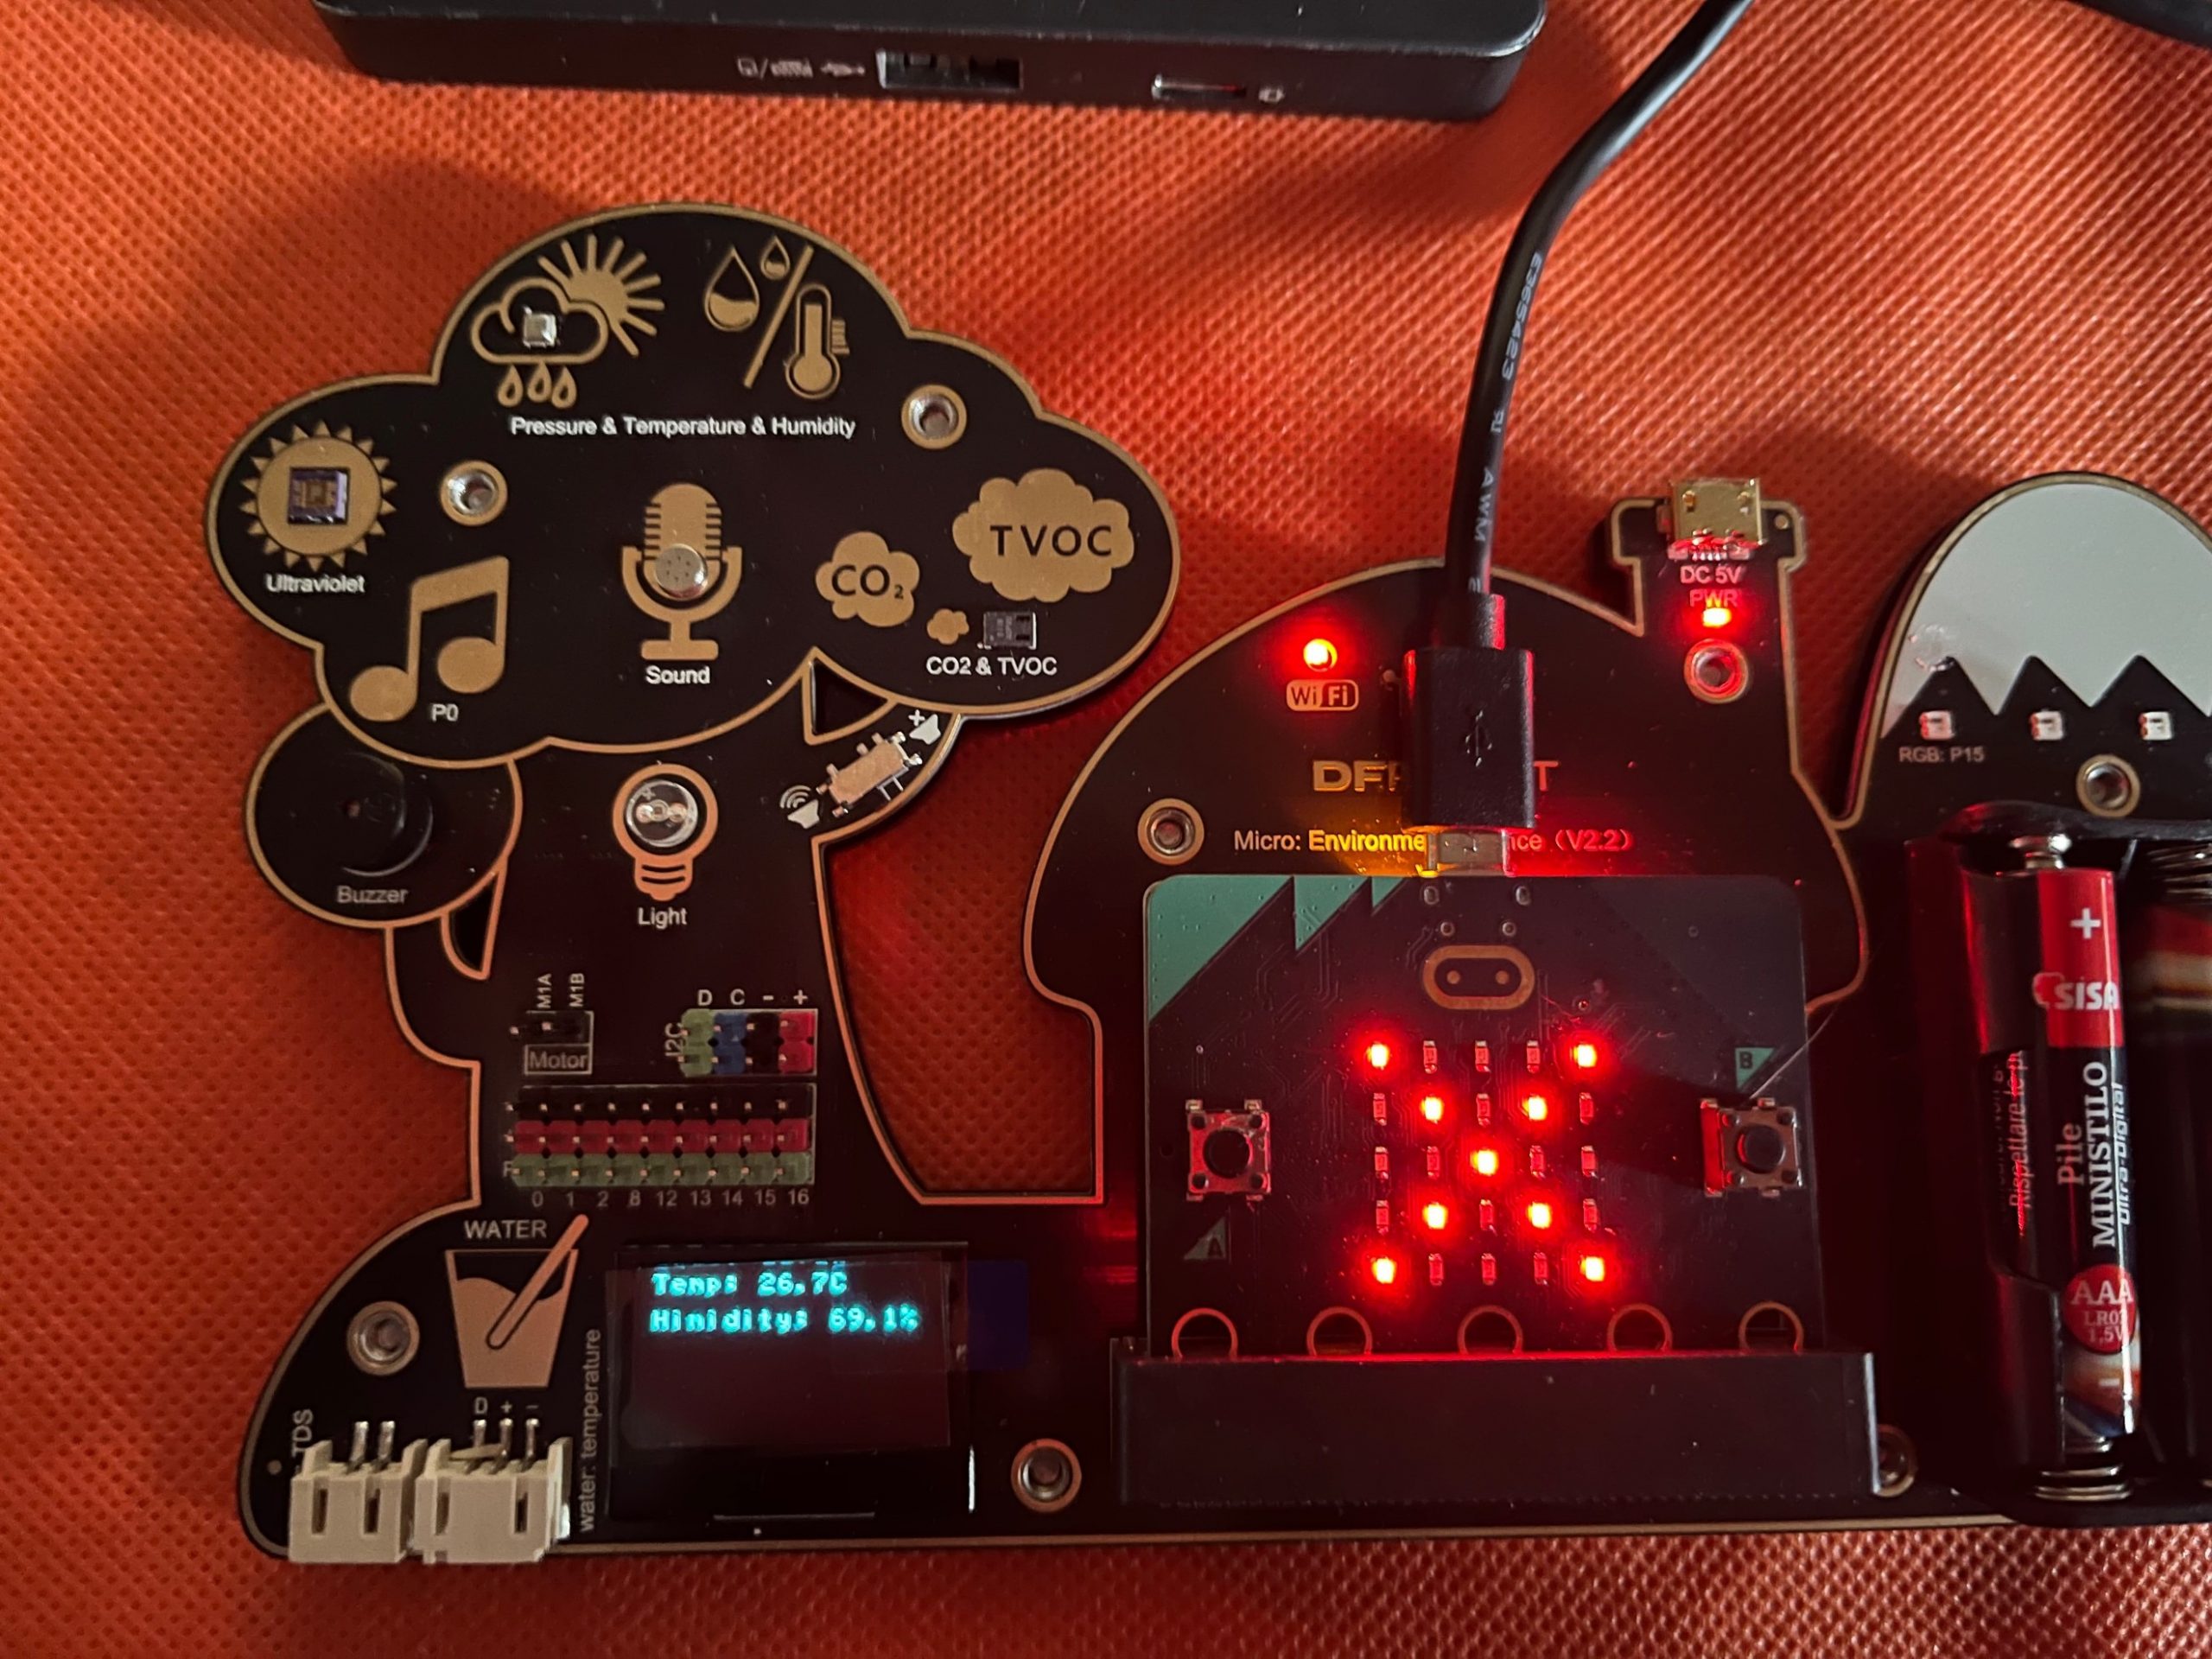
Normal temperature – high humidity
Try to modify the code by yourself or import the file microbit-Temperature-Humidity.hex
What we learned so far
Through the experiences above, we have Learned the effects of temperature and humidity on human comfort. Mastered the current temperature and humidity measurement methods. We measured the temperature and humidity around us through programming and experienced the sensor’s measurement.
Water and its properties
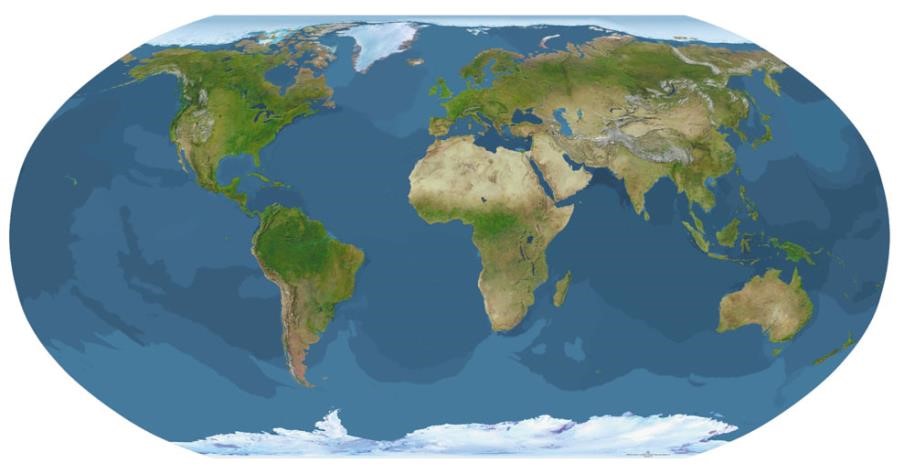
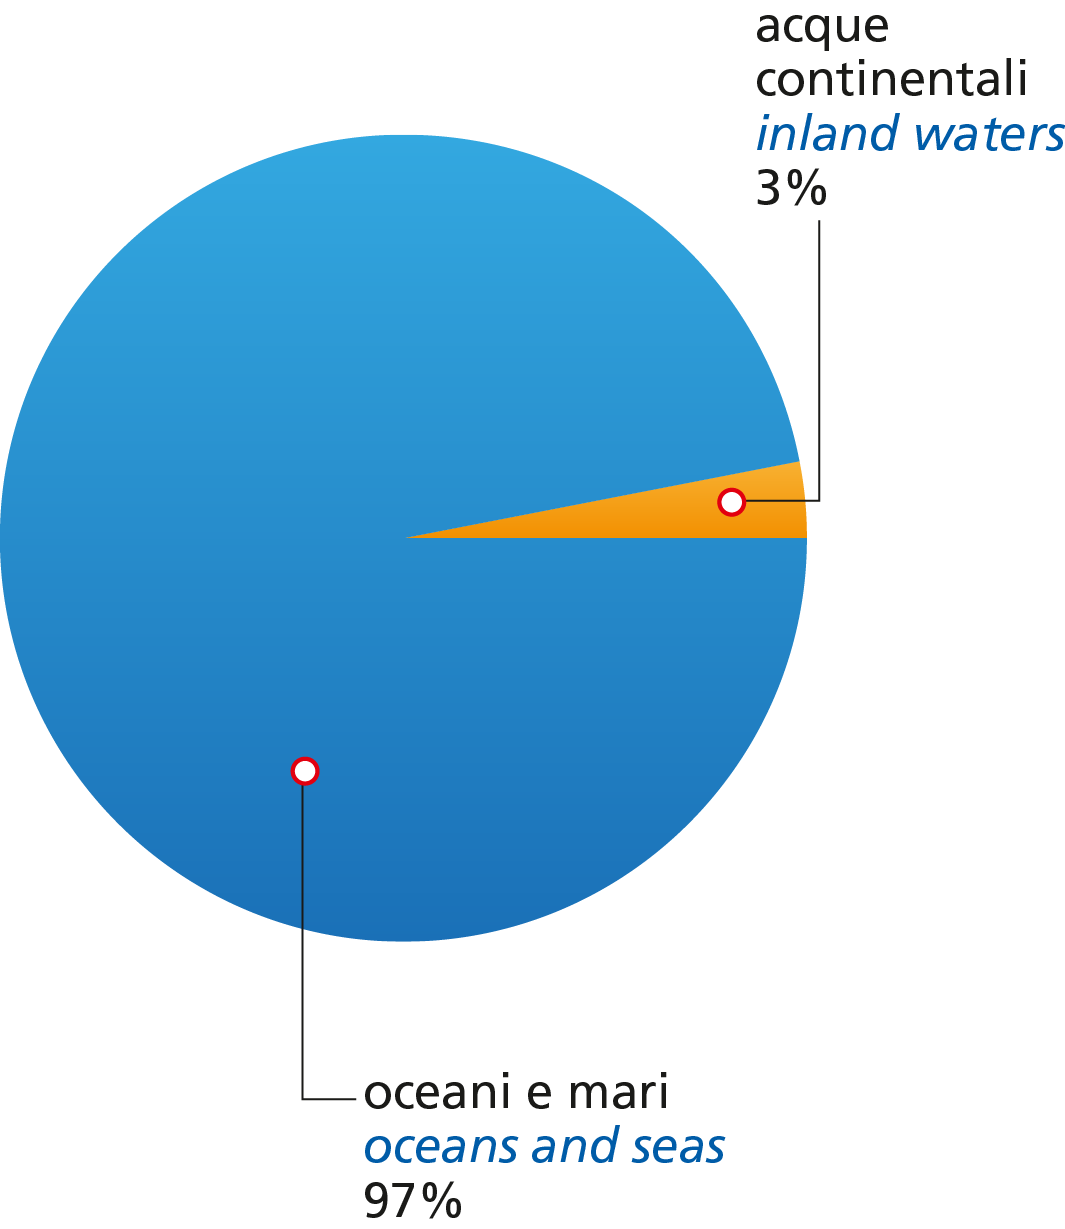
The hydrosphere is the set of all the waters on Earth. It includes the oceans and seas and continental waters (lakes, rivers, glaciers and groundwater). A small volume of water is also present in the atmosphere.

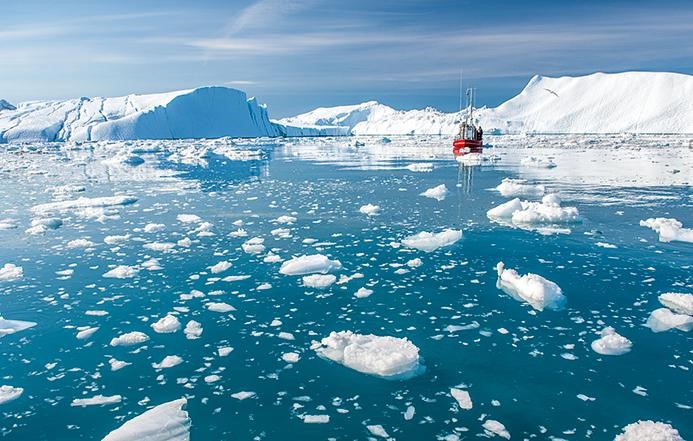
Water can be solid, liquid or gas.
Water becomes denser as it cools, but only until it reaches 4°C, at which temperature it is at its maximum density (almost 1 g/cm3).
At 0 °C the density of ice is 0.99984 g/cm3 and this causes the ice to float on slightly less cold liquid water.
The properties of water are strictly related to its chemical composition and structure.
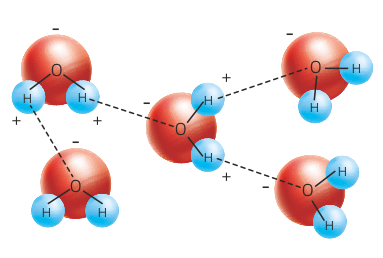
The water molecule consists of one oxygen atom (O) and two hydrogen atoms (H).
THE PROPERTIES OF WATER
- high surface tension
- capillarity
- high specific heat
- high heat of evaporation
- maximum density in the liquid state
- excellent solvent
At all times on our planet there are changes of state that allow a continuous exchange of water between the land, the sea and the atmosphere. All of these exchanges constitute the hydrological cycle or water cycle.
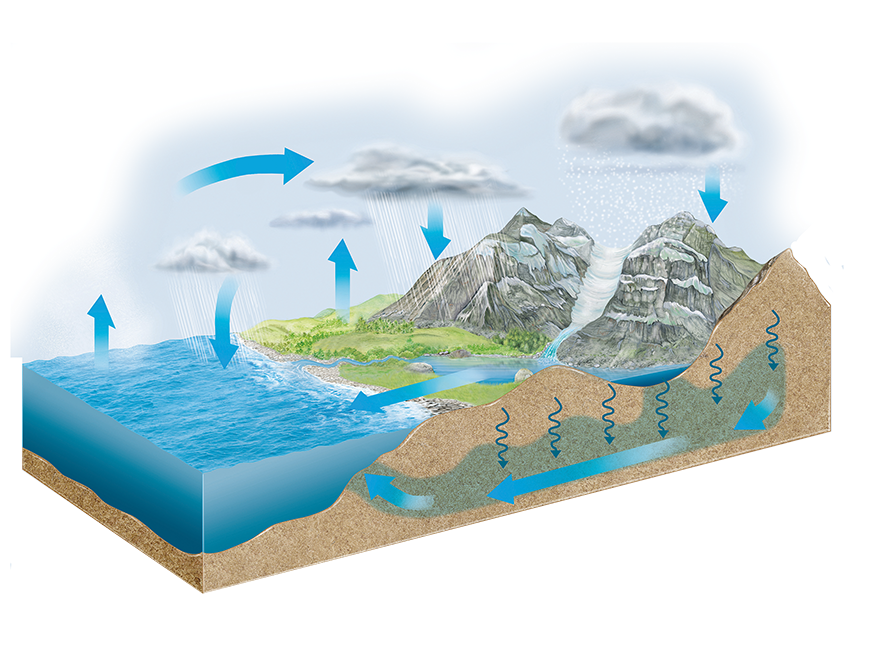
Sea and oceans are the largest reservoir of water. However, sea water is a mixture of water and substances:
- salts of different types;
- gases in solution;
- solid particles in suspension.
All the waters of the hydrosphere that are not found in the sea but on land (rivers, lakes, glaciers and underground aquifers) are called continental waters.
Continental waters are only 3% of the hydrosphere and represent the main reserve of fresh water.
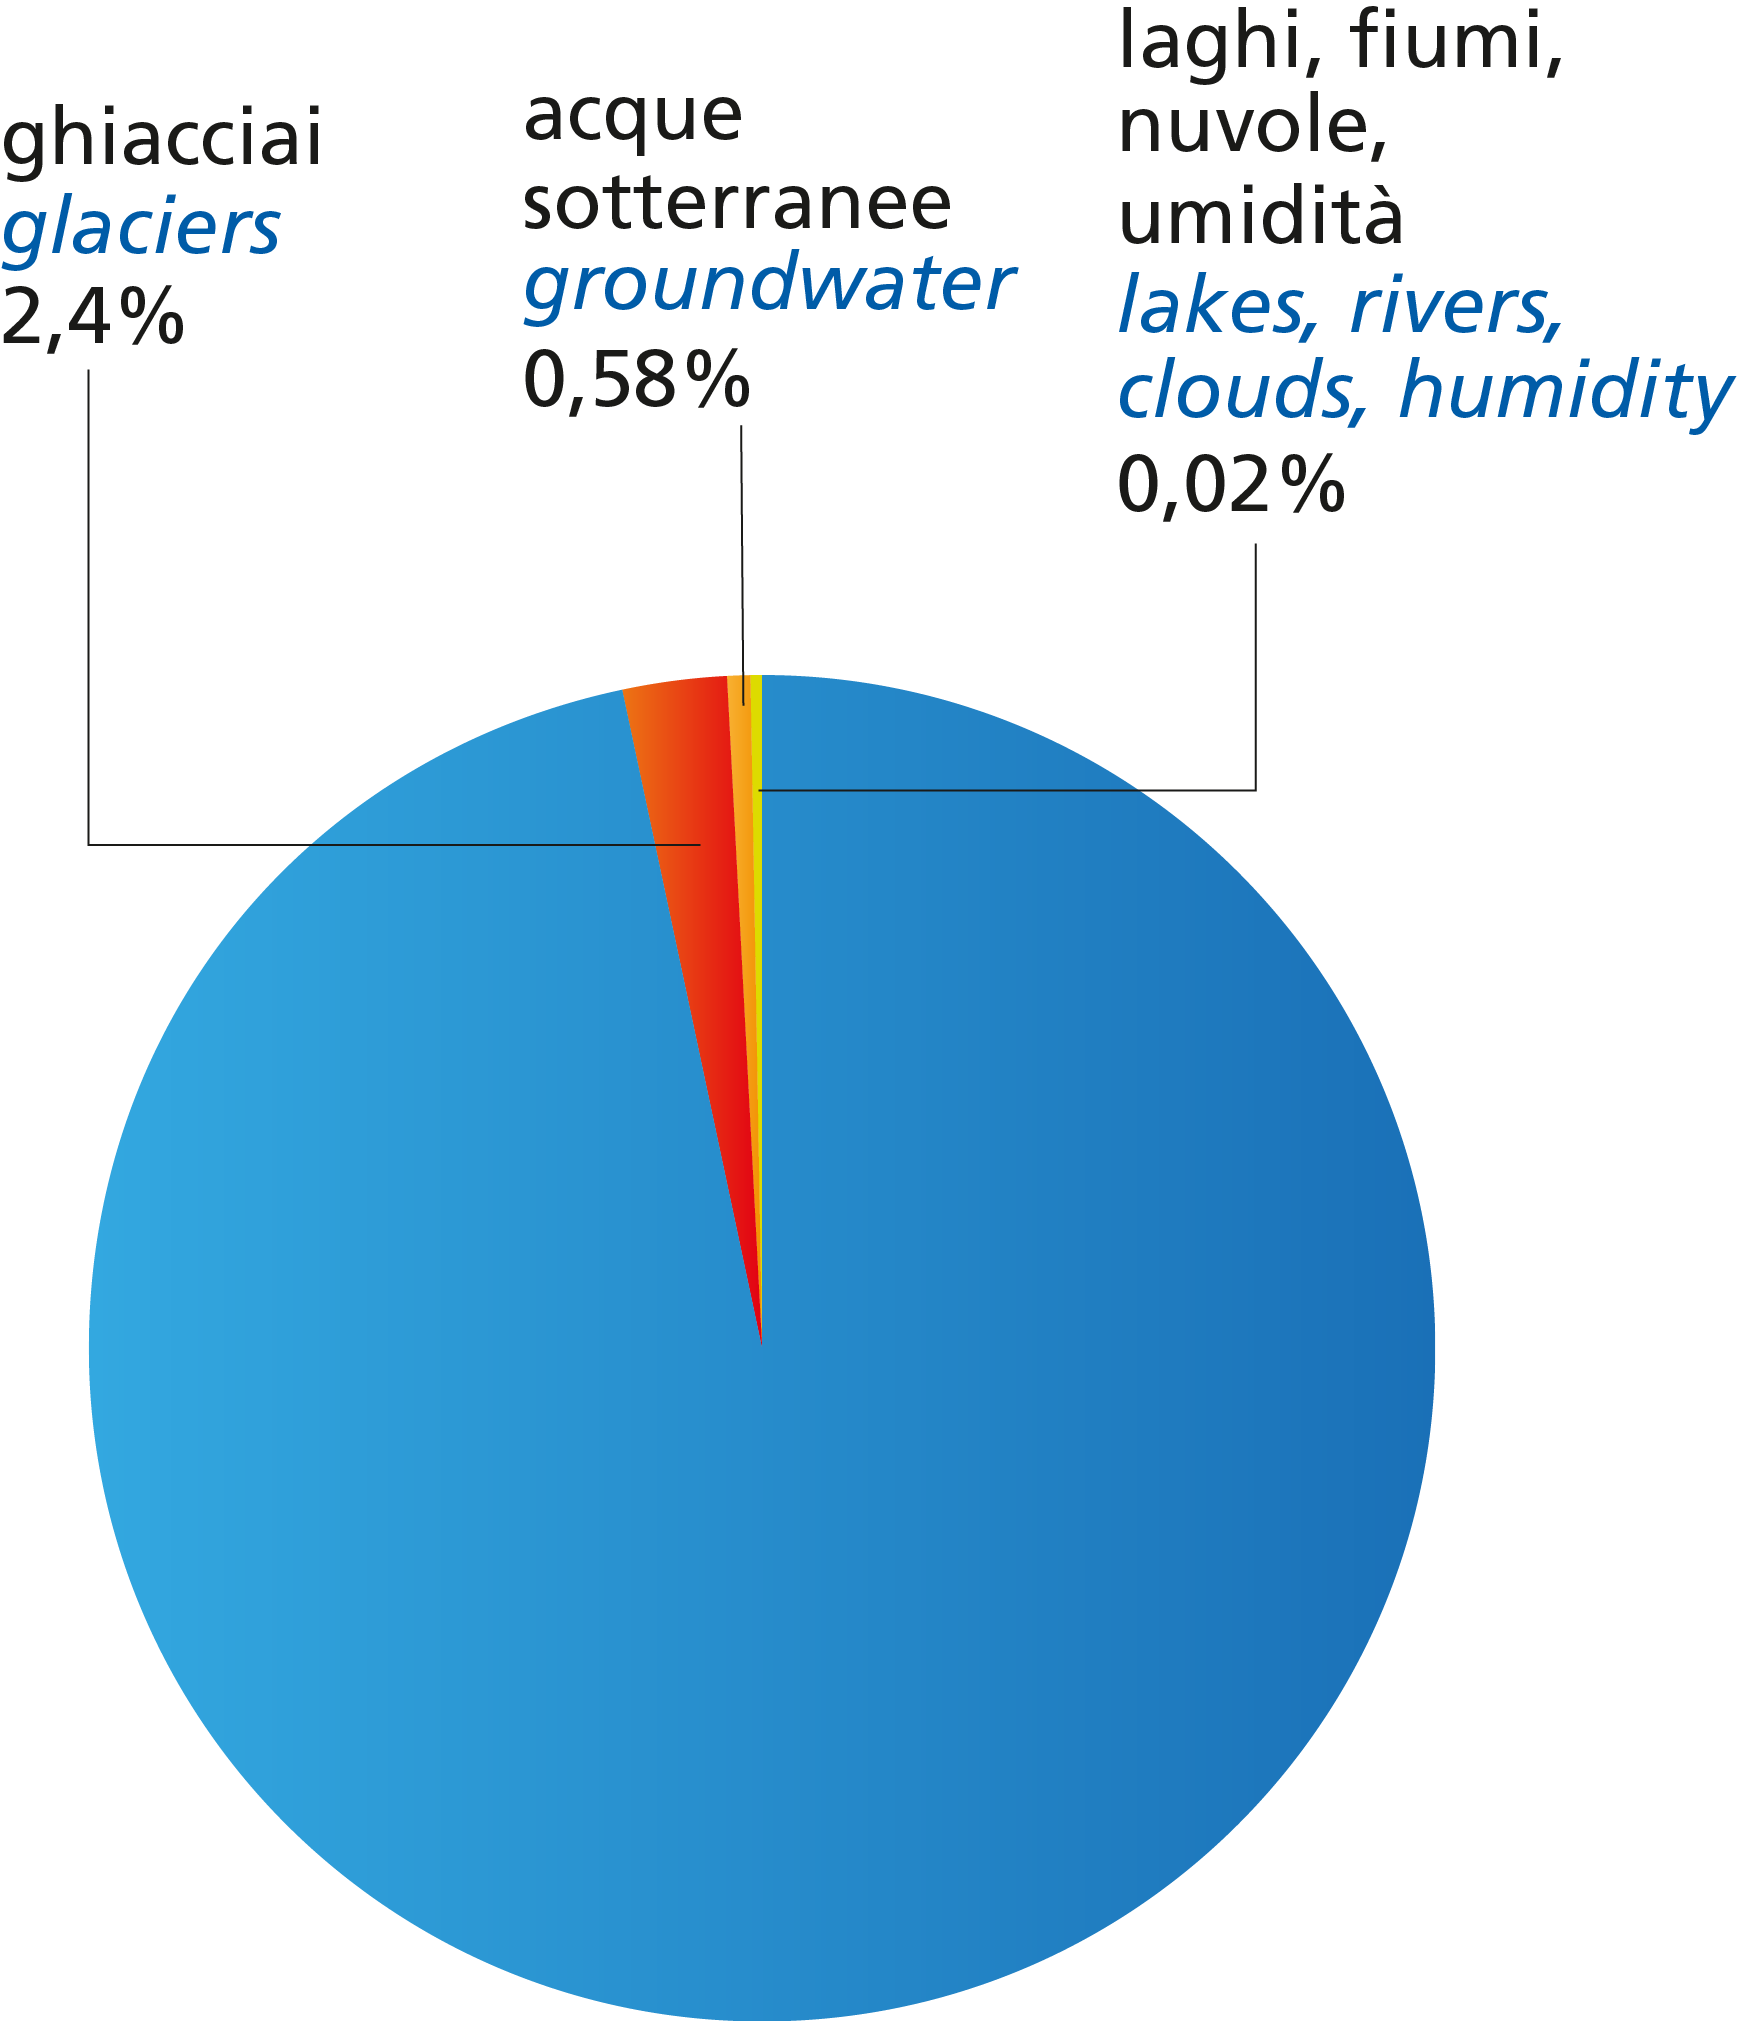
The major reservoirs of fresh water in the hydrosphere are glaciers. The largest of our planet are found in the polar regions, where they are called ice caps. The other terrestrial glaciers are found on the main mountain ranges: the Himalayas, the Andes and the Rocky Mountains. There are small glaciers in the Alps today. This means that indeed only about 1% is available as drinkable water.
The largest consumers of fresh water are:
- Agriculture: more than70% of freshwater is used for agriculture purpose. The amount of water used varies from place to place and depends on factors such as the type of food being produced, local climate conditions (the temperature and how often it rains) and the irrigation systems used.
- Industry and energy: after agriculture, industry is the second largest user of water, accounting for 22 percent of global usage. Water is used for many industrial purposes, such as cooling, cleaning, heating, generating steam, and transporting dissolved substances or particles. In addition, water is an essential part of many products (like drinks, cosmetics, or medicines). While the volume of water for industrial use is relatively low overall, industry affects water availability through pollution. A lot of industrial waste is discharged into open water sources, harming the quality of large volumes of water.
- Domestic use: There’s water for drinking, of course: humans need a minimum of 2 litres of drinking water per day to survive. In addition, we need water for cooking, cleaning, washing and sanitation. Globally, domestic use accounts for 8 percent of the water used by humans.
Population, urbanization, pollution, climate change, poor management, etc. all poses serious risk for water scarcity and worse water quality.
Understanding the water properties is the first step for a good management of water resource.
We will see how to measure:
- Water temperature
- Water ph
- Water TDS
Introduction to Water Temperature Measurements
In our daily life, we can meet water at many different temperatures. For example, tea, coffee, bath, swimming and so on, involving equipment including heaters, water dispensers, water heaters, temperature controllers and so on. So how do we detect and control the water temperature? As for the environmental temperature we can use either bulb-based thermometers or more sophisticated digital sensors.
In our example, we will familiarize with the water temperature sensor.
The water temperature sensor consists of a sealed metal housing an internal temperature sensor, as shown below: when we put the water temperature sensor in the water, the temperature of the water is transmitted to the internal temperature sensor through the metal thermal conductor, which causes the sensor value to change. That’s how the water temperature sensor works.
Let’s start to use our board to read the water temperature.
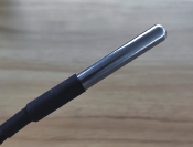
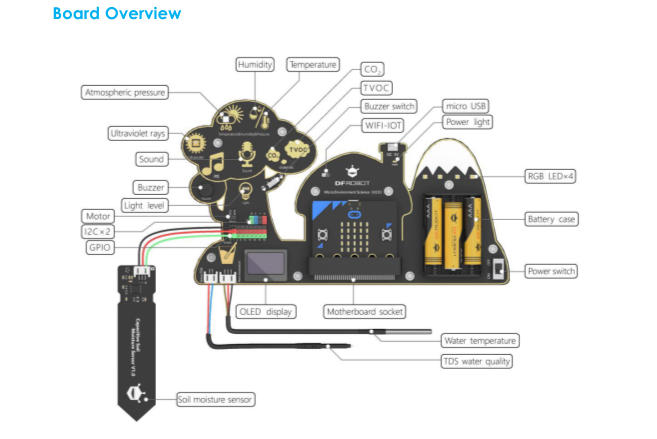
Plug the water sensor connector into the board white connector where water is printed on.
As in the previous case we need to prepare a code which instruct the board to read the water temperature and print-out into the OLED screen.
Import the file “microbit-Water_Celsius-F.hex”
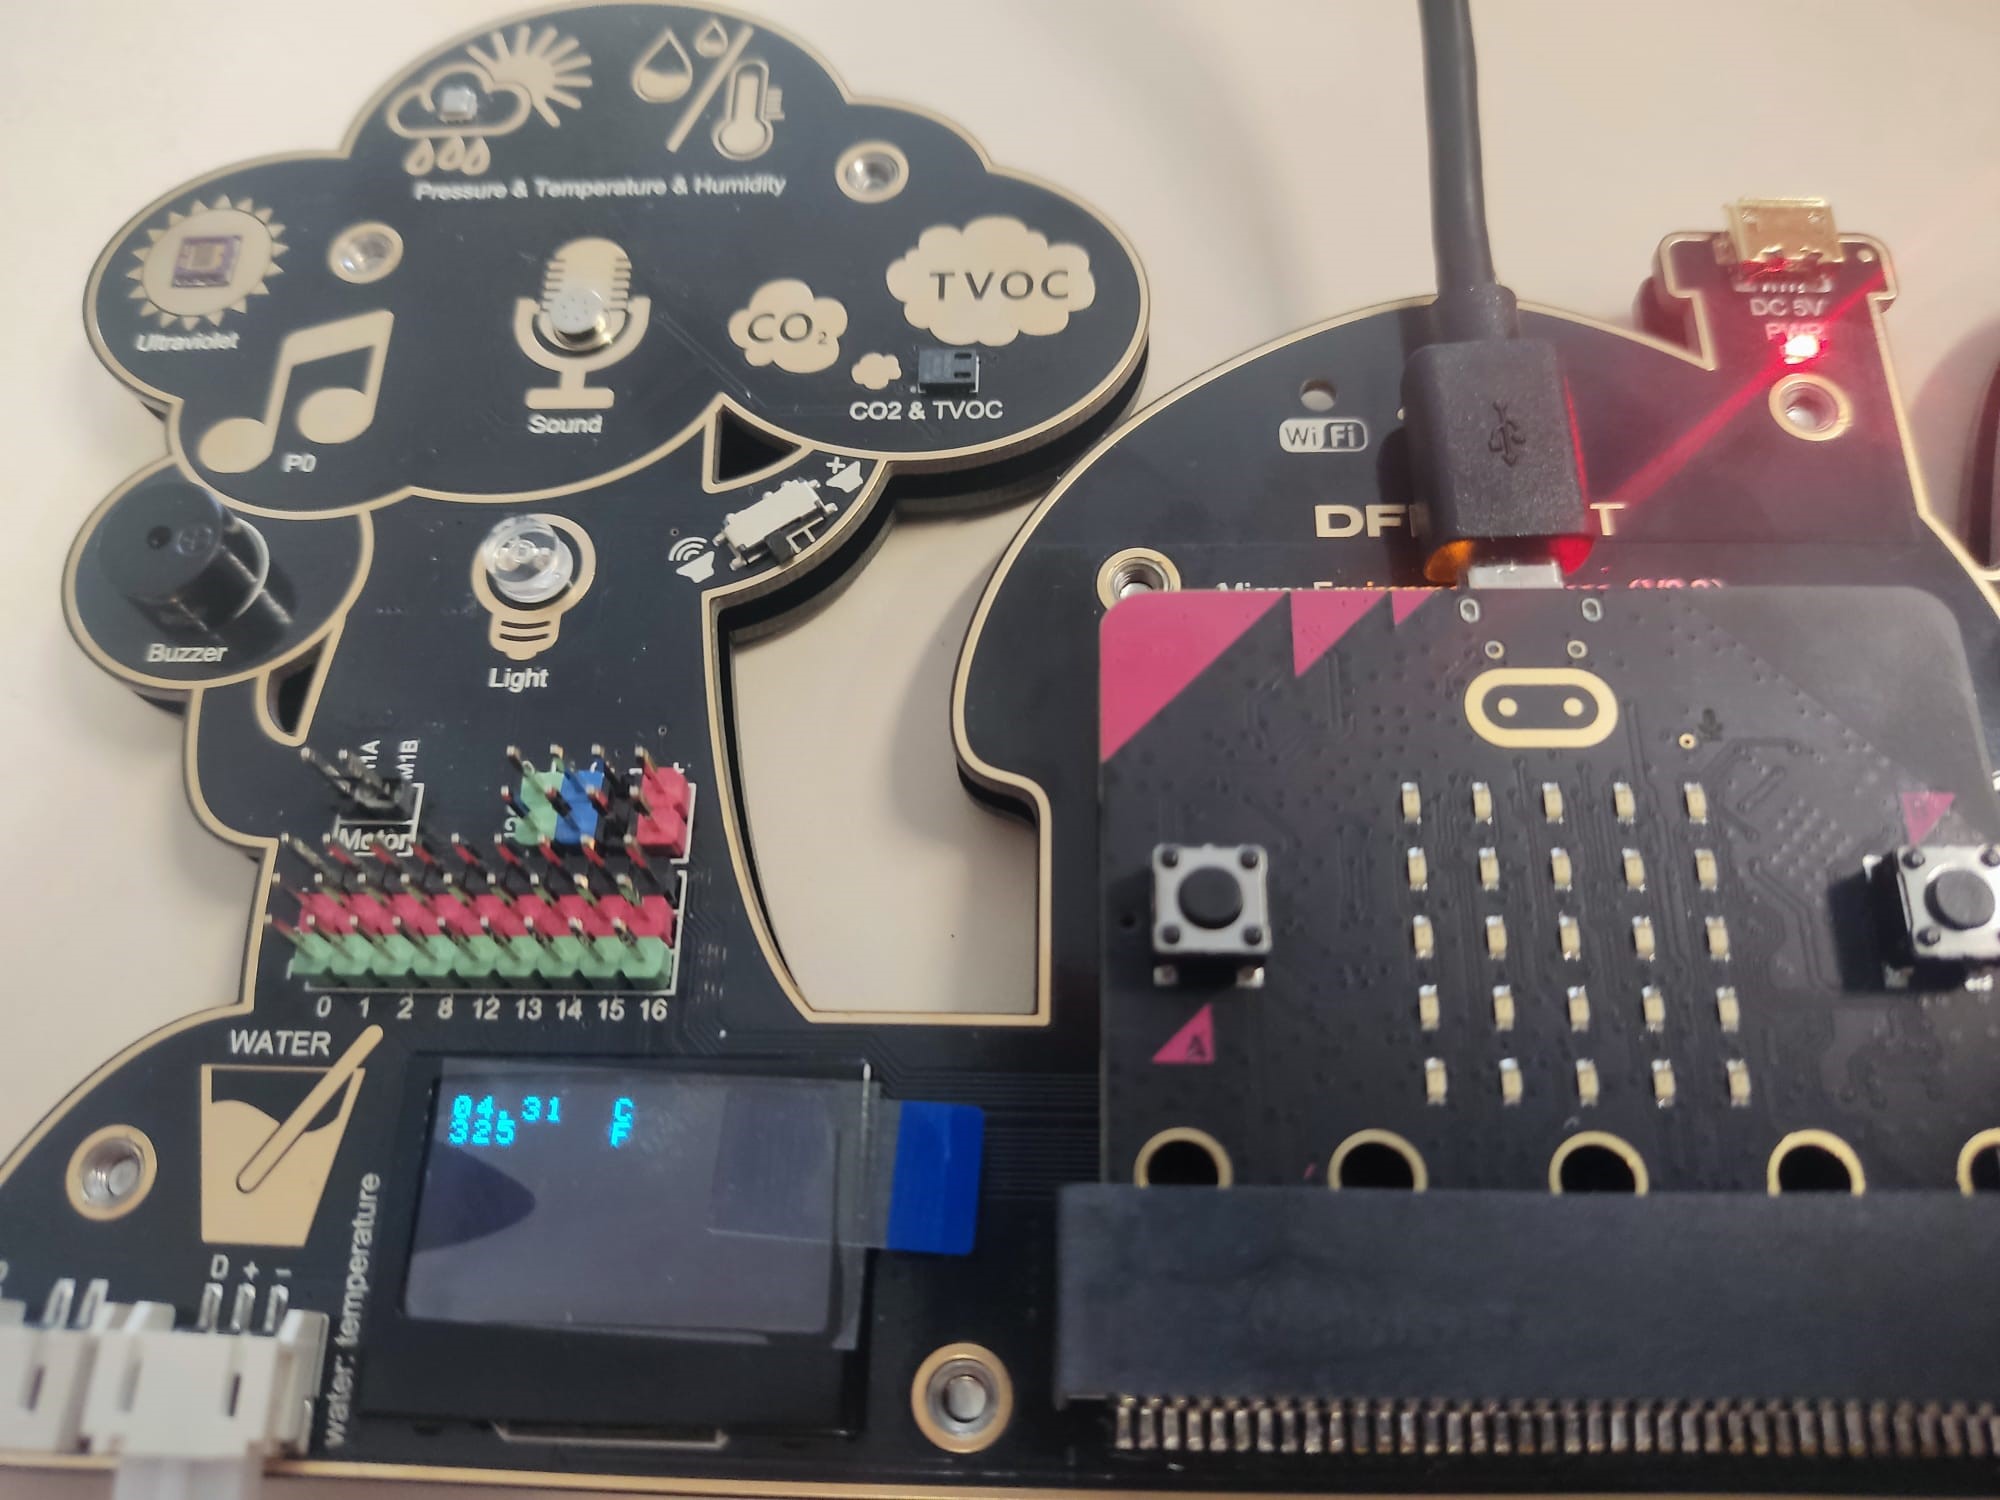
It cleans up the OLED, read the water temperature and print it on the OLED screen both in Celsius and Fahrenheit degrees.
You may wish to add also the measurement of the environmental temperature to compare with the water one.
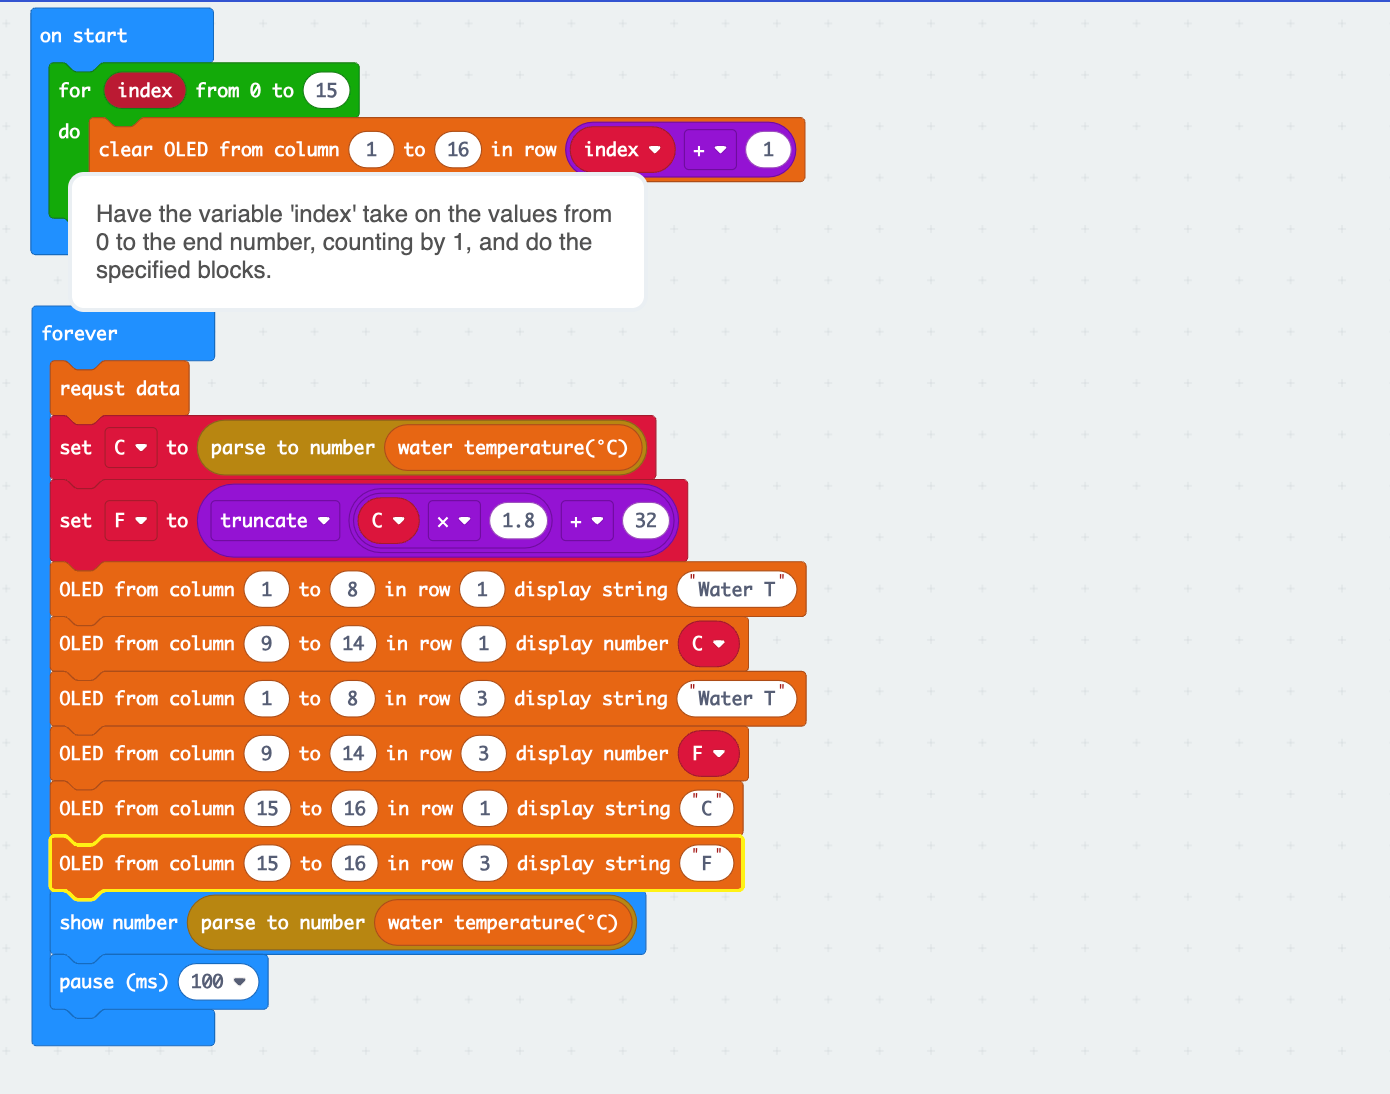
In this case just add these few lines

Please also note this instruction to show the temperature also in the micro:bit board as a blinking number
Introduction to TDS Water Quality
We learned that our drinking water resources are very limited, we understand water pollution, we know how to save water, protect water resources and so on. So now let’s learn about water quality measurements. To begin with, let’s look at a noun: TDS. TDS is an important parameter that affects water quality.
What is the TDS value?
The TDS value refers to the total dissolved solid, also known as the total amount of soluble solids, measured in mg/L. It shows how many milligrams of soluble solids are dissolved in 1L of water.

The higher the TDS value, the more dissolved matter is contained in the water, so we can easily say that the TDS value partly reflects the purity of the water. The lower the TDS value, the higher the water quality, the higher the TDS value, the more soluble solids contained in the water. Please pay attention: liquids with high TDS values are not necessarily harmful.
For example, for the water inside the river, TDS value is about 400. And tap water is about 100, bottled pure water is about 10, while the TDS value of juice is 500. From the values above, the purity of bottled pure water is very high, impurities are very small. The TDS value of fruit juice is 500, but it is harmless to humans.
But TDS is not the only criterion for determining water quality. TDS can only measure conductive substances in water, but cannot detect bacteria, viruses, and other substances.
Insights to be discussed with higher grade students (you maybe relates to Chemical lectures).
TDS stands for Total Dissolved Solids. This item measures minerals, salts, and metals present in water. It includes both harmful substances and mineral salts that are good for our body. The TDS value is measured in PPM (parts per million).
The TDS is a synonym of the fixed residue: that is, the quantity of substances dissolved in water that is obtained once the liquid is boiled at 180°.
Through the fixed residue it is possible to classify water into:
Minimally mineralized (residue less than 50 mg/L). It is a water low in salts and highly digestible. It is ideal for newborns.
Oligomineral or slightly mineralized (residue between 50 and 500 mg/L). Provides a good supply of mineral salts.
Mineral (value between 501 and 1500 mg/L). It is suitable for elderly people and those who practice physical activity.
TDS can influence the appearance, taste and smell of water: the higher this value, the more likely the water you will have will be cloudy and with altered taste and odor.
Using the TDS values, it is possible to classify water into:
Fresh water: less than 500 mg/l or TDS = 500 ppm.
Brackish water: 500 to 30,000 mg/l or TDS = 500 to 30,000 ppm
Saline water: 30,000 to 40,000 mg/l or TDS = 30,000 to 40,000 ppm
Hypersaline: greater than 40,000 mg/l or TDS greater than 40,000 ppm.
Household tap water must have a TDS of less than 500ppm.
Let’s move to the measurement.
Connect the TDS probe to the electronic board. Leave connected or connect also the water temperature probe (as in the previous example)
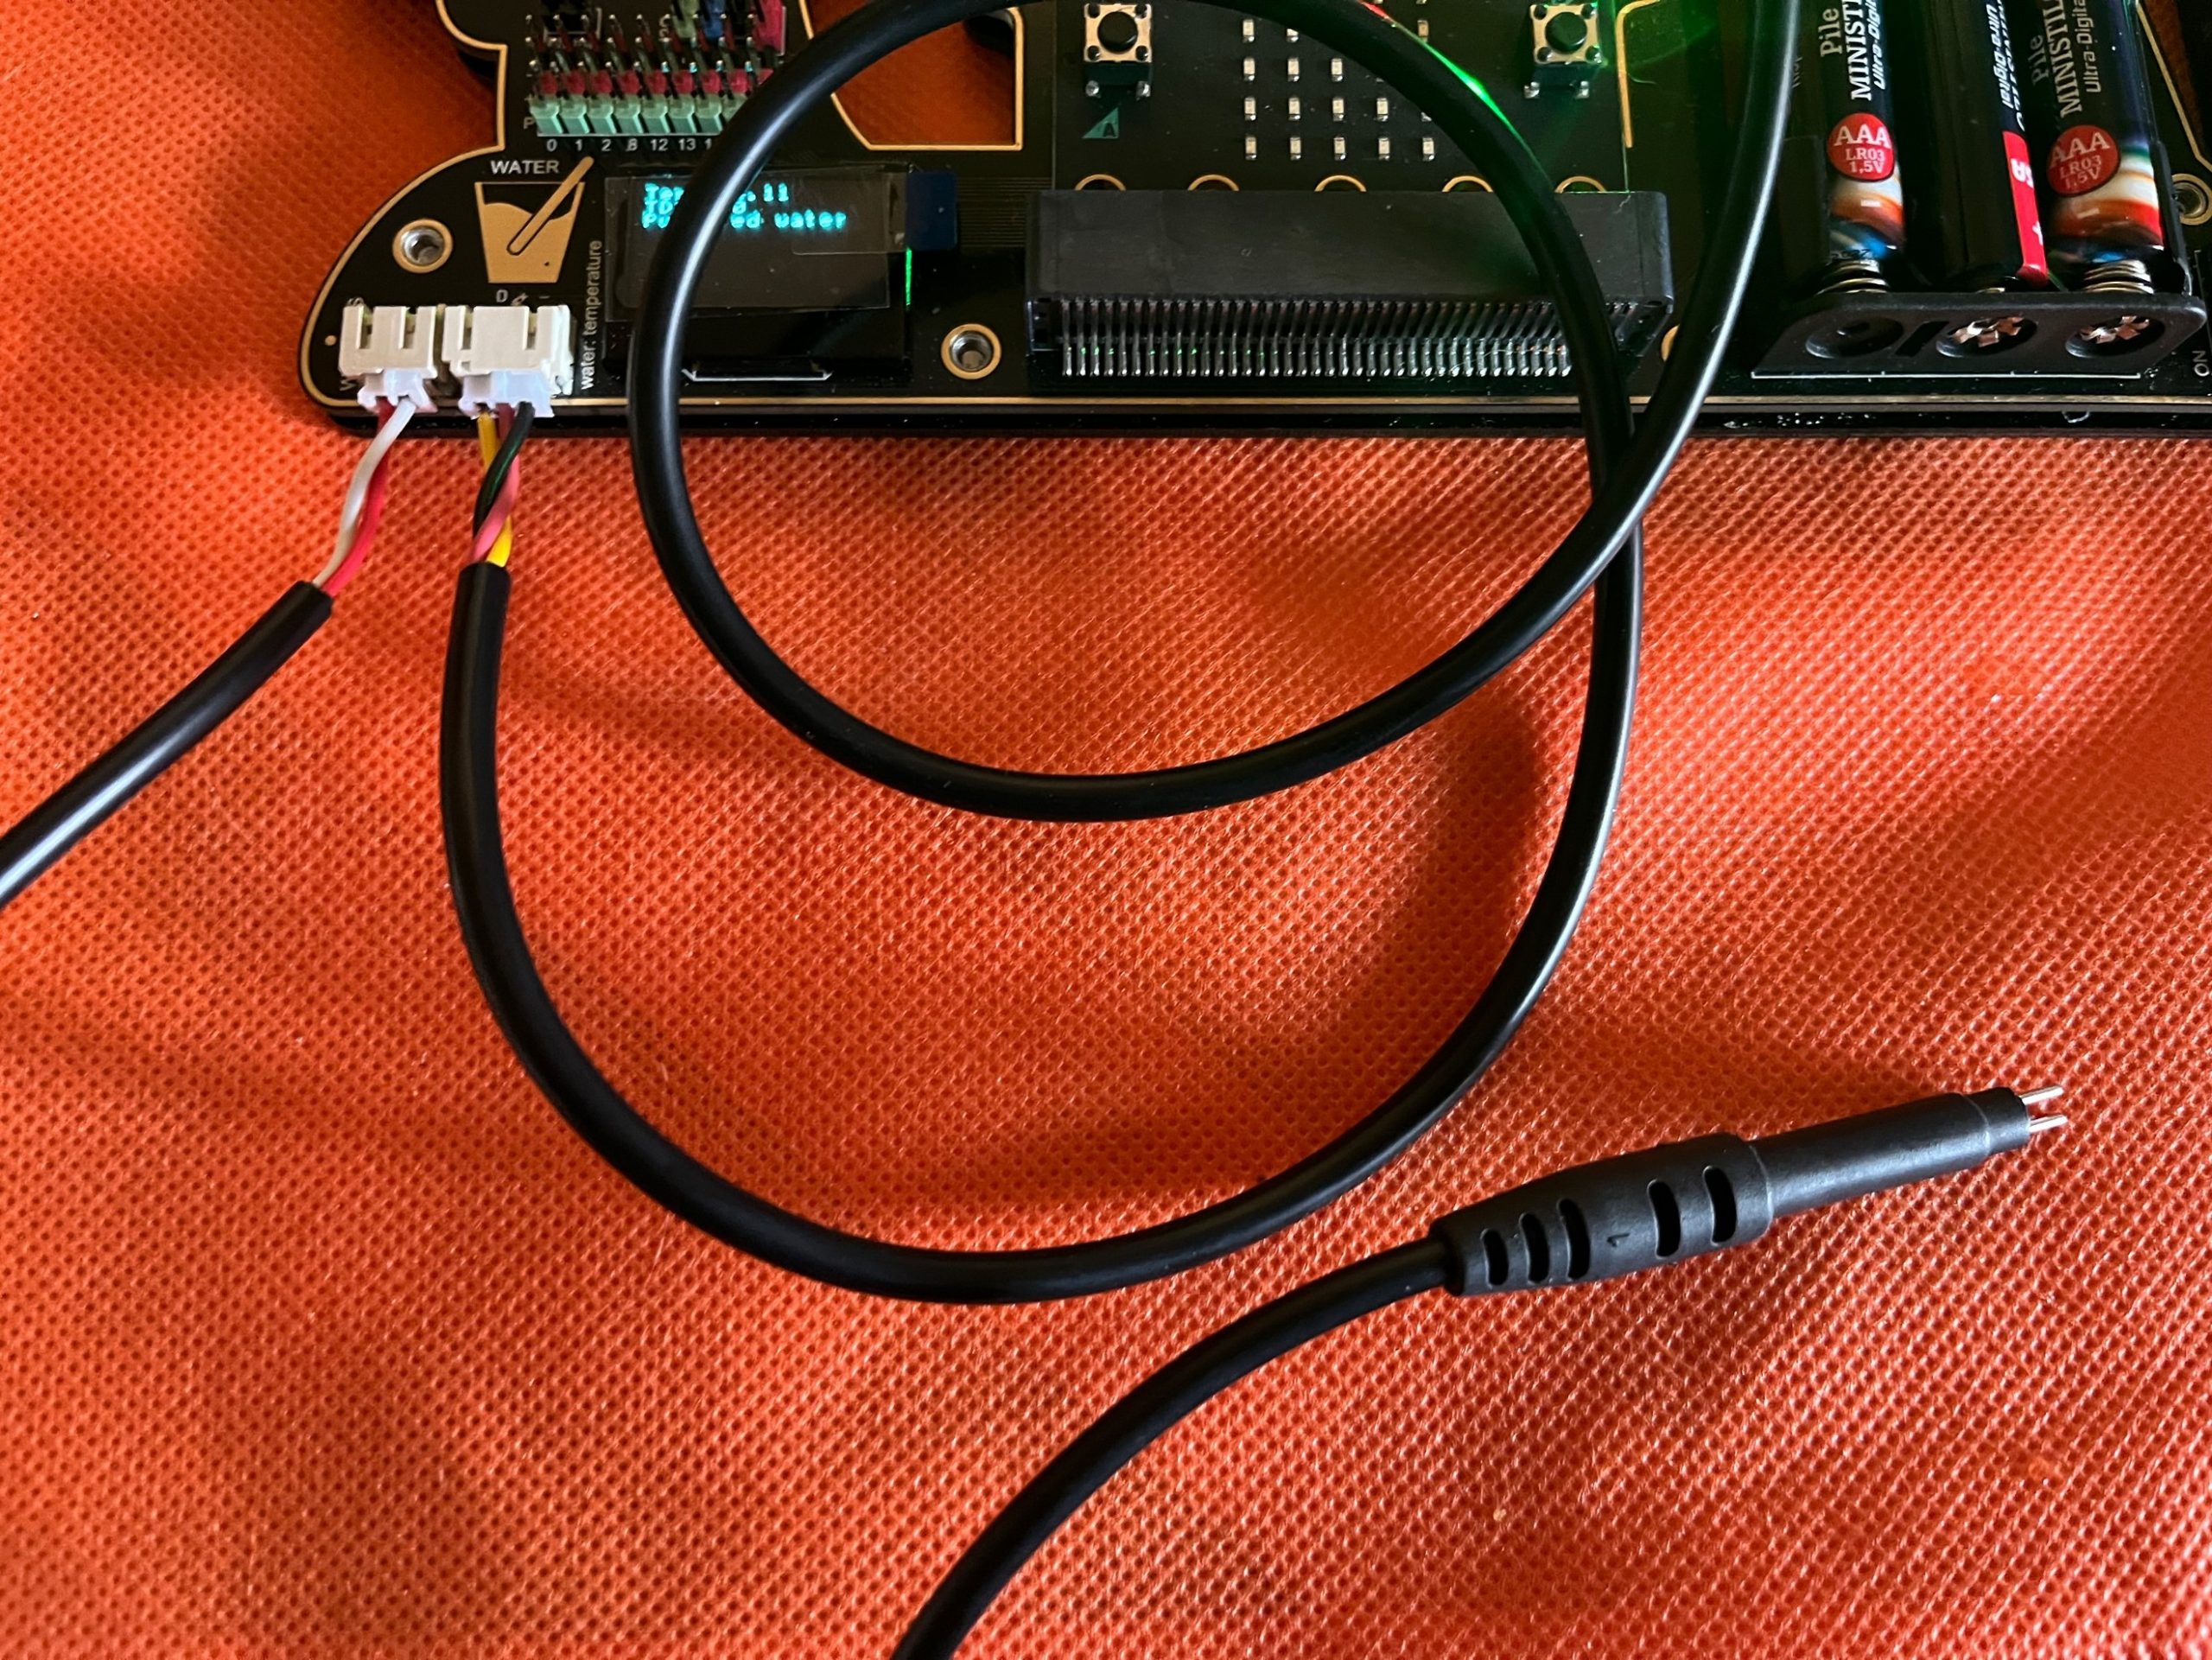
Import the file microbit-TDS01_Temp.hex from our repository: the code will enable you to measure both the water temperature and the TDS value. DOWNLOAD on the board in the usual way.
Program description: the code cleans up the OLED screen and then ask the electronic board to provide the value of the Water temperature and TDS value

According to the TDS value in the OLED you will find also a classification:
TDS<150 Pure water – Green light in the board
150<TDS<550 Tap water – Yellow light in the board
TDS>550 warning: Too high residuals in the water – Red Light in the board
Use the code to perform water quality parameter measurements
Select few samples of water:
- Mineral water (should be the lowest in TDS)
- Tap water
- Some soft drinks or juices
- Prepare some solutions of salt and water
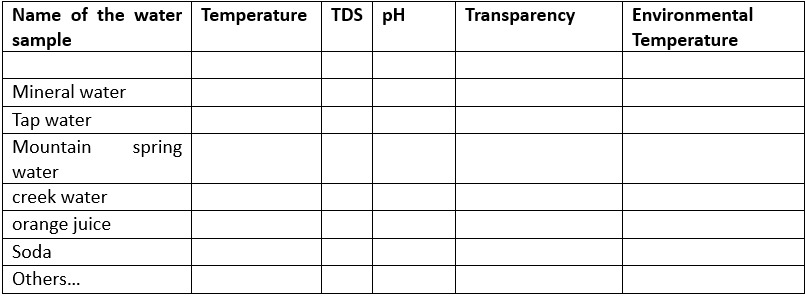
Insert the two probes into each of the liquid sample and fill the table.
NB: remember to clean up the probes before you move from one sample to the other.

Insights for higher grade students: comment with the students why it is important to repeat the same measurement several times. Discuss about the error and the statistical significance of the measurement.
Further tests: take some tap water and measure the TDS. Then boil the water and wait until the temperature goes down to < 55 oC (remember the TDS probe cannot work for higher temperature). You can check the water temperature by leaving inside the water the WaterTemperature probe.
What do you expect for the TDS value: an increase or a decrease? Try to discuss with the students/
Once the temperature is lower than 55 oC measure again the TDS and check your hypothesis.
Other water characteristic
pH
The pH of water is the measurement of the concentration of acids (Hydrogen Ions H+) or bases (Hydrogen Ions OH-) in an aqueous solution, or, in other words, the measurement of the acidity of a solution. A solution is said to be “acidic” when its pH is between 0 and 7, “neutral” when the pH is equal to 7 and “basic” with values between 7 and 14.
The EU legislation on the potability of water intended for human consumption requires that the pH value of water supplied by public aqueducts is within the range 6.5-9.5. This range guarantees ideal organoleptic characteristics, i.e. pleasant flavour, transparency and almost imperceptible odor and, at the same time, allows for optimal resistance to bacterial contamination.
The main methods for measuring pH are colorimetric, i.e. “tornasole paper (litmus paper)” and use of liquid reagents or tablets. Alternatively, the use of specific instrumentation is envisaged, i.e. a pH meter (measurement with electrode probe).
We will use tornasole paper (which you find in the kit) for the measurements.
Select several different water samples (you can use the same as before) and immerse in each of them a tornasole strip for few seconds. Let them dry up a bit and then compare with the color scale to understand the value of the ph.
The tornasole paper measurement provide a quali-quantitive estimate of the pH. For a more precise measurement you need to use a ph-meter sensor which however is not included in the kit.
Transparency
Water transparency is directly linked to the property of water to transmit light. For small sample of water, you can just estimate water transparency by qualitative estimation looking at any possible suspended material.
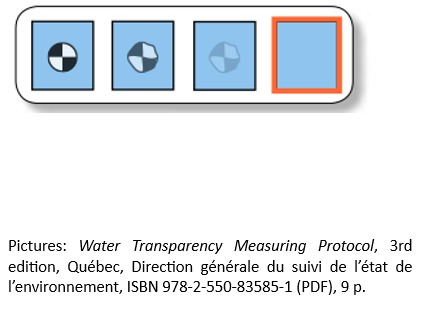
For large water quantity the transparency may be estimated by an old and inexpensive system called “Secchi disk”. The Secchi disk (or Secchi disc) was originally created in 1865 by Angelo Secchi. Nowadays Secchi disks are realized by a black-and-white circular disk 20 cm in diameter mounted on a line and lowered slowly down in the water. The depth at which the disk is no longer visible is taken as a measure of the transparency of the water.

You may wish to build up one Secchi disk in your class and leave to the student for summer holidays.
You can use an old CD and color it black and white.

Select several water samples and complete the following table by using micro:bit board and other tools to test your water
Soil and its properties
What is soil
Soil is the topmost layer of the Earth. It derives from the alteration of rocks, i.e. from their disintegration and transformation by air, water and living organisms.
A soil is always made up of three components.
- solid component;
- water, with dissolved mineral salts;
On average, the solid component occupies half of the volume of a soil, while the other half is made up of water and air.
Soil properties
Porosity is the set of tiny empty spaces, called pores, present between the solid particles of the soil.
Permeability is the ability of the soil to let water pass through it. It increases with the size and number of pores in the soil.
A physical characteristic of the soil is the texture, or grain, which indicates which type of granules are predominantly present: in fact, it may happen that a soil is made up of a large quantity of sand granules and little clay or that it contains a lot of humus and little gravel and so on. To measure how much gravel, sand, silt, clay and humus there are in a soil, it is necessary to mix a sample of the soil and let it settle at the bottom of the container so that the various components separate. The technique to use is sedimentation. The percentage distribution of the various types of granules allows soils to be classified as: gravelly, sandy, silty, clayey, humous.
An easy qualitative experiment to understand soil texture:
Take several containers and put different kinds of soils, leave for few hours (better a day) and look at them later on
Which kind of composition the soil samples have?

Permeability is also linked to the other physical characteristics of the soil. You will have noticed that, after the rain, the water disappears quickly in some areas, in others it stagnates and forms puddles on the surface. Why?
In the illustrated experiment the same quantity of water is poured on the same quantity of sand, clay and potting soil.
For each sample, the quantity of filtered water collected in the container is measured and the time taken by the water to filter is recorded by reading it on the chronometer. The results demonstrate that sand lets water pass faster, clay retains more, potting soil has a mixed composition and therefore has intermediate characteristics between the other two samples. A soil that allows water to pass through it easily and in a short time is defined as permeable.

Permeability is the ability of a soil to let water pass through it and depends on the porosity: the greater the porosity, the greater the permeability. Gravelly and sandy soils are permeable, while clayey soils are impervious.
Closely linked to these two characteristics is also the ability to retain water: if a soil is waterproof, it will remain soaked for longer, while if it is permeable it will dry easily and quickly.
How is soil formed?
Soil is formed by the slow reaction of rocks with air and water on the surface of the Earth. The process of soil formation is called pedogénesis and includes four phases.
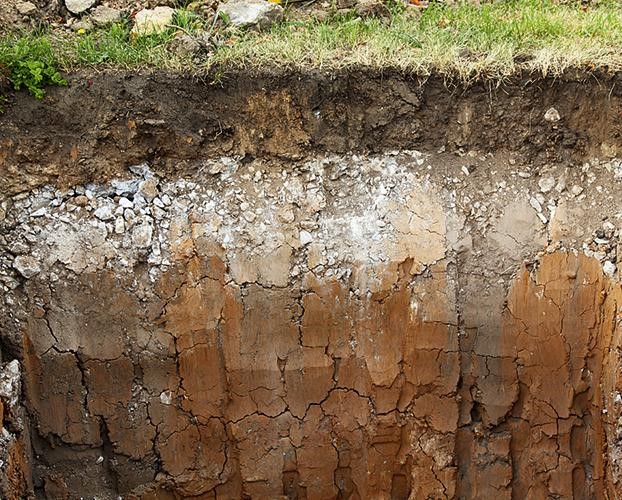
Over time the soil thickens and becomes mature soil. When a soil is mature, by digging deeply, three distinct layers can be recognized, called soil horizons: topsoil (superficial horizon), subsoil (intermediate horizon), bedrock (mother rock).
The characteristics of each soil depend on the type of parent rock and the climate. Based on the type of rock of which they are formed, soils are divided into two large groups:
- calcareous soils, derived from calcareous rocks, i.e. rich in calcium carbonate;
- siliceous soils, derived from rocks that contain silicate minerals.
Calcareous vs siliceous soil: an experiment to do in the Chemistry Classroom

A calcareous soil has granules of calcium carbonate, a substance also contained in bones and eggshells. Calcium carbonate can be recognized through a simple test: after placing some soil in a test tube, slowly add a few drops of hydrochloric acid (you must be very careful: it is corrosive!). Calcium carbonate reacts with hydrochloric acid and develops effervescence due to the formation of carbon dioxide. A soil is calcareous if it effervescences with hydrochloric acid (a).
Siliceous soil, on the other hand, is made up of silicon minerals which are hard enough to scratch glass. Siliceous soil can be recognized by placing a pinch of it on a slide and sliding it onto another slide (b).
Soil and Life
Soil is a very important natural resource, essential for life on Earth.
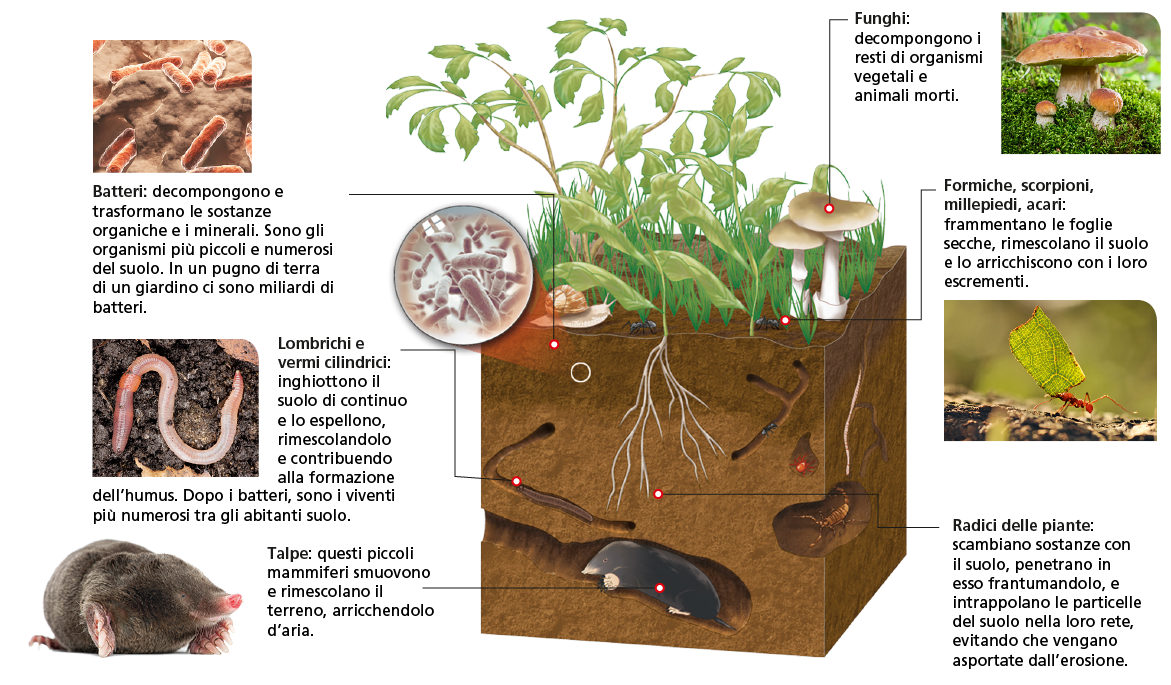
The main agricultural processes are two:
- ploughing, which serves to break up the clods in depth to improve porosity and mixing with fertilizers and air;
- controlled irrigation, to give the soil the right amount of water, even with the arrangement of drainage channels and furrows for the flow of water.
One of the most effective cultivation techniques, developed since the Middle Ages, is crop rotation. In the three-year rotation the fields are divided into three strips in which three different crops are sown which alternate each year.
Plant life depends on the physical characteristics of the soil. Good soil must be porous and permeable, but not too much, to prevent it from drying out completely, and retain water, but not too much, to prevent the roots from rotting: that is, it must have the different characteristics in the right balance. Some vegetables, however, such as potatoes, carrots and succulents, live well in sandy and permeable soil; others, such as rice, wheat and corn, prefer clayey and impermeable soils: it depends on the type of root and how the plant itself retains water. Even the chemical characteristics of a soil are important for plants: olive trees, vines and legumes are suitable for living in calcareous soils; the blueberry, the rhododendron, the chestnut live well in siliceous soils.
Water in soil
The amount of water in soild = humidity or moisture of the soil is one of the most important parameter to guarantee safe life of plants
The optimal humidity depends on the type of plants but in general a good humidity of the soil should range between 70-90 %.
Let’s measure together the humidity of the soil with our electronic board. In order to do that we need to plug the soil moisture sensor in our electronic board.
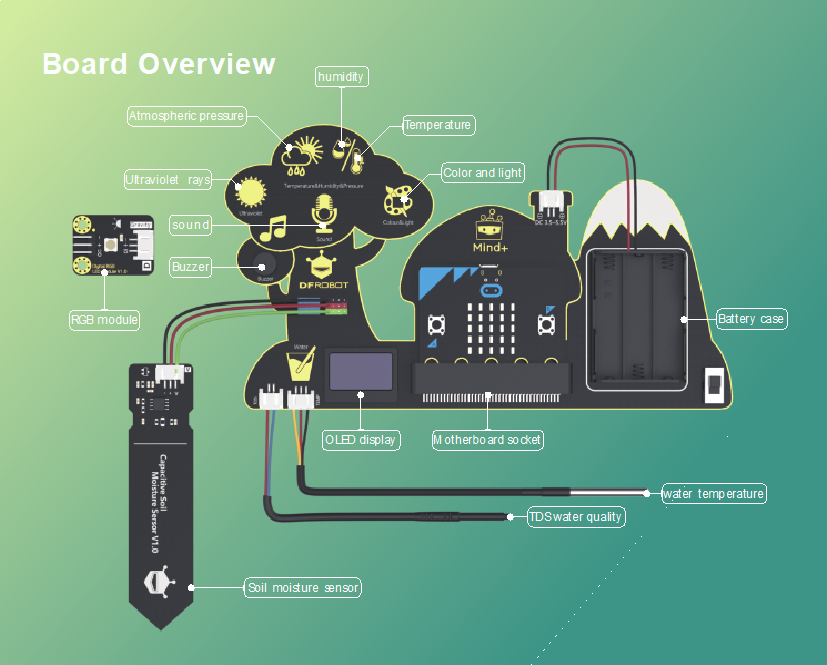
Connect the connector of the sensor to the second line of pins in the board. Pay attention to the polarity. The black cable goes to the black pin.
Before being able to read reasonable results, we must calibrate the sensor in dry environment (humidity 0%) and in water (humidity 100%).

Import the file microbit-Soil_calibration.hex from our repository: the code will enable you to calibrate the sensor. DOWNLOAD on the board in the usual way.
Program description: the code cleans up the OLED screen and then ask the electronic board to provide the value of the soil moisture in absolute value.

Try to first measure the humidity of a completely dry soil and annotate the number, repeat the measurement by measuring the humidity of water and annotate this second number. In my set-up the dry value corresponds to 802 while the water one to 400. Your values should be in the same range, but they may differ a bit.
Import the file microbit-Soil_calibrated.hex from our repository: the code will enable you to read the water temperature using the appropriate sensor and the soil moisture. DOWNLOAD on the board in the usual way.
Program description: the code cleans up the OLED screen and then ask the electronic board to provide the value of the water temperature and soil moisture. You need to change the calibration values according to your previous measurement. Modify the program and put your values. In the example program, we map 400 to 10, 802 to 0. In the actual test, the humidity is 0 when reaches the lowest, and the highest humidity is 10. Once you have inserted your values you can plug the sensor in different soil plant and read the soil moisture in %. Typical ideal moisture should be around 70%.

Further tests for higher grade students: if your students are interested you may try to develop a more challenging project to create a system to automatically irrigate plants.
In addition to the electronic board, you need
Additional materials:
- 1 micro servo
- 1 ice cream wooden stick
- 1 big glass
- 3-4 elastics
- 1 clear tape roll
- 1 straw
- 1 pair of scissors

Fix the micro-servo on the wooden stick using one elastic. Check that the arm of the servo is parallel to the stick and place the wooden stick on top of the glass filled of water and fix it with the elastics and some tape. Connect a small straw to the servo arm and insert it into the water.
Plug the servo connector on the pin and connect the straw to the servo arm.


Now you can add into the code a condition that move the servo arm when the soil moisture is too low.
i.e., you may choose watering the plant when the soil moisture is lower than 40%, so we need to add an if condition in the code to do that

In this code if the soil humidity is under 40% the board will show an umbrella and the servo motor will change the angle of the arm to pour off water into the plant.
Ultraviolet Rays
Ultraviolet radiation, which is directly invisible to our eyes, is the general term for radiation of wavelengths in the electromagnetic spectrum from 10nm to 400nm. Excessive ultraviolet ray intensity can damage human’s skin and harm health.
UV light has been discovered in 1801 by the German physicist Johann Wilhelm Ritter. He observed a darkening accelerated paper impregnated with silver chloride when exposed to invisible rays just beyond the spectrum visible at the violet end. To distinguish these rays from the “heat rays” (IR) discovered the previous year to the other end of the visible spectrum, he called UV radiation “oxidizing rays”, which emphasized chemical reactivity that he had observed. This was quickly replaced by the term “chemical rays” that remained popular throughout the rest of the century. In the end, the terms chemical radius and heat ray have been replaced with designations ultraviolet and infrared, now common.
According to the wavelength, the ultraviolet light can be divided to near UVA, far UV UVB and ultra-short UV UVC. The penetration of ultraviolet rays in human skin is different. The shorter the wavelength of ultraviolet light, the greater the harm to human skin. Short-wave UV rays can pass through the leather, and medium-wave can enter the leather.
UV light may cause:
- Damage to the eyes: when exposed to ultraviolet light, the degree of eye injury is proportional to the time, inversely proportional to the distance from the source of the exposure and is related to the angle of projection of light.
- Damage to the skin: when UV rays strongly in the skin, it can lead to light dermatitis, red spots on the skin, itching, blisters, edema, eye pain, tears, etc. Severe skin cancer can also be caused.
- Damage to the nervous central system: when UV light acts on the central nervous system, it may lead to headache, dizziness, elevated body temperature and other symptoms.
However overexposure to UV rays may be negative, there are also health benefits if you can moderate UV exposure. The three main benefits for the health of exposure to UV rays are the production of vitamin D, improved mood and the increase in energy.
In this chapter, the program will use a UV sensor to measure the UV intensity and determine whether it exceeds the specified value.
Measurement of UV Rays
Import the file microbit-UV.hex from our repository.
Program description: the code cleans up the OLED screen and then ask the electronic board to provide the value of the UV intensity and display it on the OLED. The unit of UV intensity is mw/cm2. When the intensity reaches 1.0 or above, the program will show changing lights.
Green UV intensity < 1
Yellow 1<= UV < 2
Orange 2<=UV < 3
Red 3<=UV<4
Black UV>=4

Air pollution
Our electronic board allows to measure the Carbon dioxide and TVOC.
Carbon dioxide is a colorless and odorless gas at room temperature. It is denser than air and can dissolve in water. The chemical formula is CO2 and it is one of the main components of the air.
Too much carbon dioxide in the air can cause breathing difficulties and even carbon dioxide poisoning.
CO2 concentration (ppm) reference values:
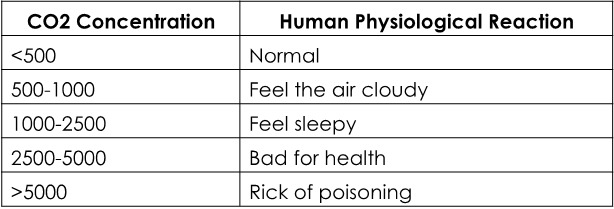
Measurement of CO2 concentration
Import the file CO2.hex from our repository.
This program will read the value of carbon dioxide and display it on the OLED. When the value is below 500, the RGB light shows green; 500-1000 shows yellow; 1000-2500 shows orange; 2500-5000 shows red; above 5000 shows purple. Because the gas we breathe out also contains a lot of carbon dioxide, we can blow to the sensor to observe the significant change of the value.

Volatile organic compounds (VOCs) are a group of compounds with high vapor pressure and low water solubility. In other words, these substances won’t easily bind to themselves (volatile) or dissolve in water (organic). VOCs are emitted as gasses from everyday products such as building materials, maintenance equipment, and custodial products. Many VOCs are harmful to human health, especially over the long term.
Much like particulate, the term “VOC” doesn’t refer to a specific substance; instead, it refers to a group of substances that exhibit similar chemical properties. There are thousands of these substances, with some examples commonly found in buildings including:
- Benzene – found in tobacco smoke, paint thinner, deodorizers, air fresheners, furniture polish
- Formaldehyde – found in disinfectants, furniture upholstery, carpets, plywood
- Ethylene glycol – found in cleaning agents, personal care products, perfumes
- Methylene chloride – found in spot removers, dry cleaned clothes, fabric cleaners, commercial solvents, air conditioner refrigerant
- Tetrachloroethylene – used in solvents, dry cleaning, paint strippers
- Toluene – used in paint, metal cleaners, adhesives
When measuring the amount of VOCs in your home, you will often come across the term TVOC, or total volatile organic compounds. Just what does TVOC stand for? What is TVOC?
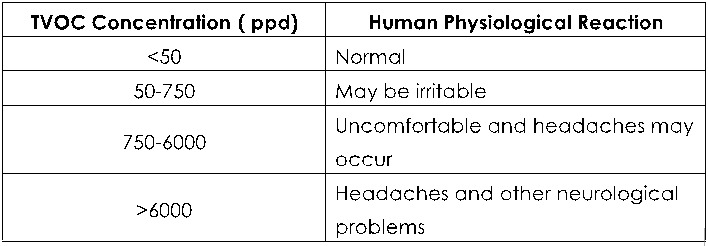
Total volatile organic compounds (TVOC) is a group of VOCs used to represent the entire pool of pollutants. TVOC refers to the organic compounds whose saturated vapor pressure exceeds 133.32 Pa at room temperature. Its boiling point is between 50 to 250°C at room temperature, and it exists in the air in the form of evaporation. Its toxicity, irritation, carcinogenicity and special odor, will affect the skin and mucous membrane, and produce acute damage to human body. TVOC is measured in parts per billion (ppb) or milligrams per cubic meter (mg/m3).
TVOC reference values:
Measurement of TVOC concentration
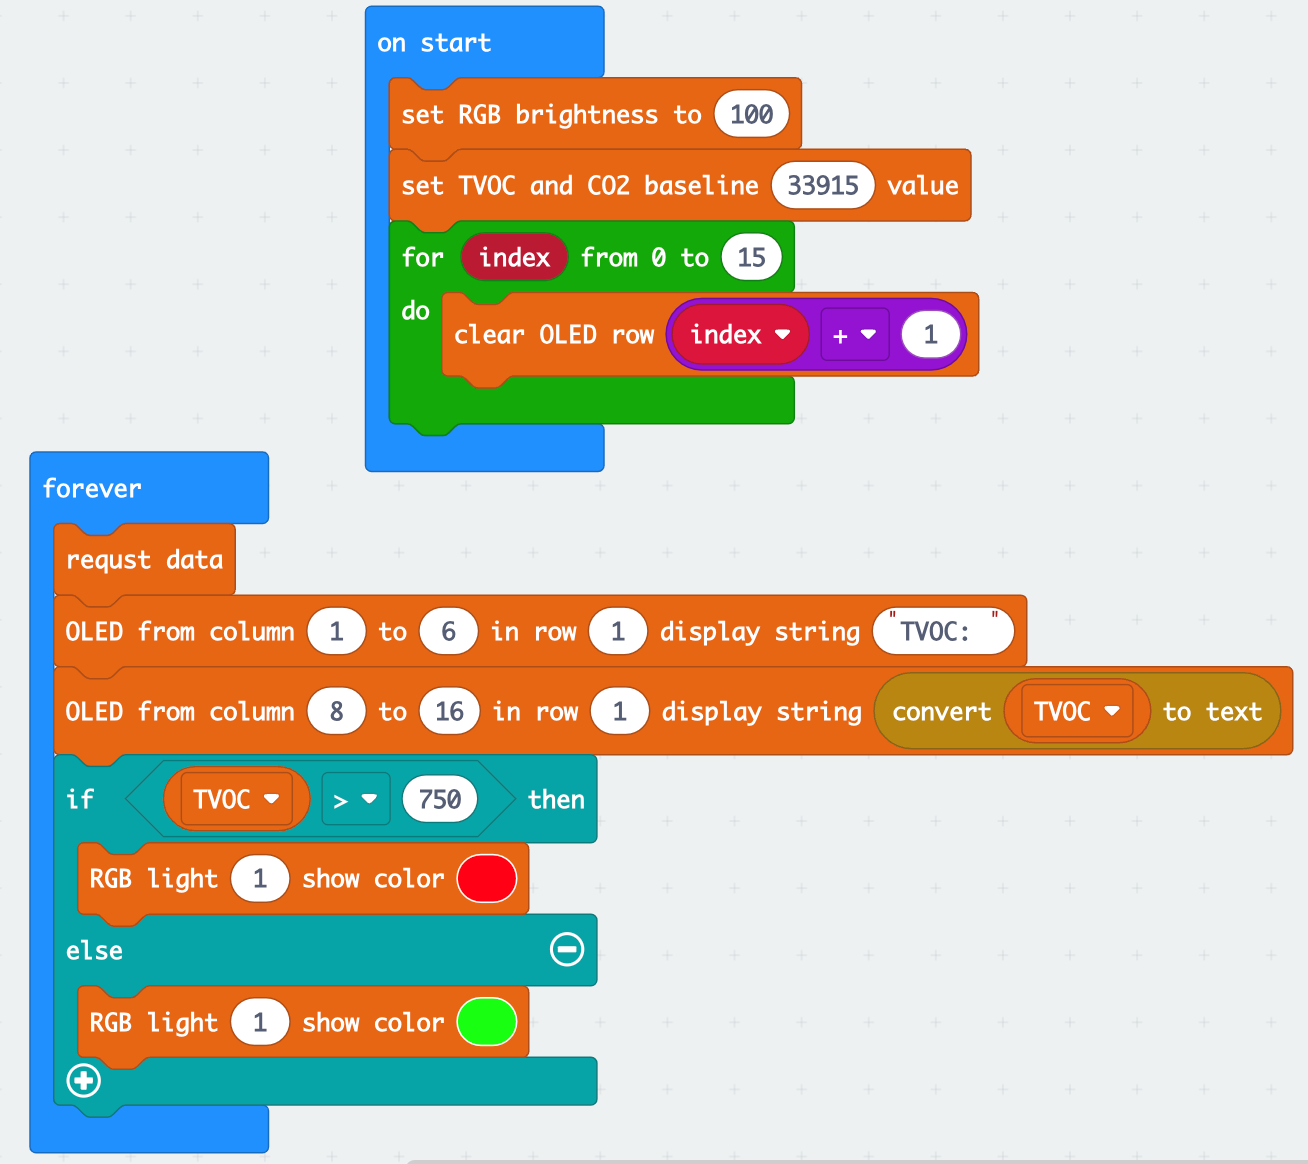
Import the file microbit-TVOC.hex from our repository.
This program will read the value of TVOC and if it is greater than 750 it will light red on the first led.
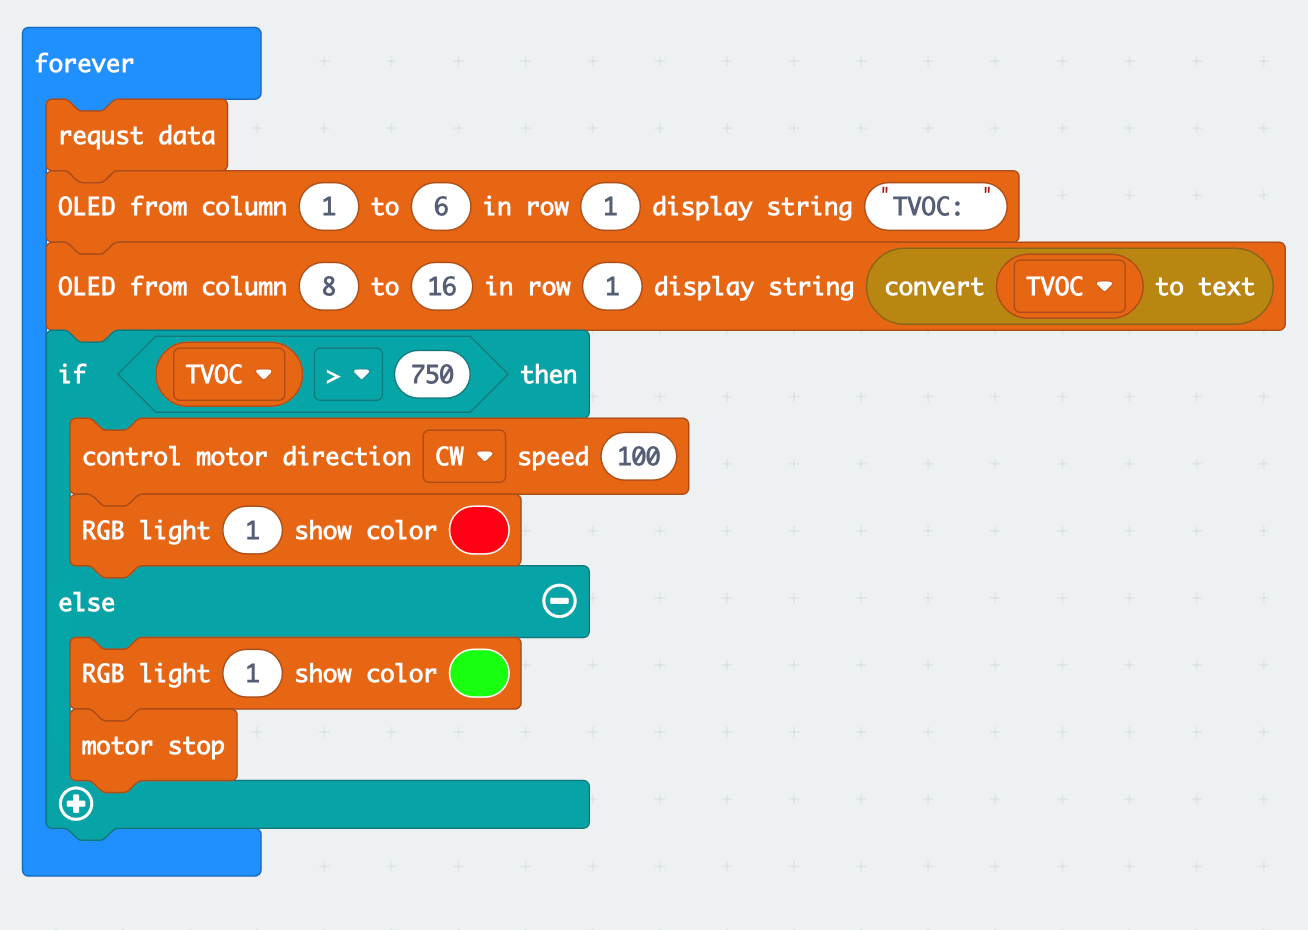
Further tests for higher grade students: if your students are interested you may use a motor and active it as a fan to ventilate the room.
The code is easy to modify.
Import the file microbit-TVOC_motor.hex from our repository. Now in addition to switch the led to red in case the TVOC is greater than 759, it also will activate the motor.
Conclusions
Environmental protection is not only the public welfare but also the responsibility of everyone, no matter what we do, as large as afforestation, as small as garbage classification. Everyone should make effort to protect the environment. A proper knowledge of environment and the most common pollutants is mandatory to raise awareness about human impact on our planet and to create future citizens who are more aware and respectful of nature. This kit gives the possibility to measure the main environmental parameters and pollutants and gives the opportunity also to develop digital skills and a multidisciplinary approach at school.
References
Tutorial of Environment Science Expansion Board for micro:bit -V2.0 Based on MakeCode
(SKU: MBT0034) – www.DFRobot.com
HUB Scuola Mondadori Education
NASA Ocean Science Division
NASA Earth Science Division
Water Transparency Measuring Protocol, 3rd edition, Québec, Direction générale du suivi de l’état de l’environnement, ISBN 978-2-550-83585-1 (PDF), 9 p.
Mondo Scienze B-La Terra, Bruna Negrino, Edizioni Il Capitello
